Quantcast
Channel: C2B2 Blog
Viewing all 223 articles
Browse latest View live

Chef - Test Kitchen and Docker

$
0
0

In today’s blog I’m going to show you how to create a local Chef development environment that can be used to provision a simple cookbook to a Docker Centos 7 instance based. This environment is based on a VMWare Workstation vm created from a Centos 7 ISO image. 


To install Docker, logon to the newly created vm as root and run the following commands: 

$ sudo yum update

$ cat >/etc/yum.repos.d/docker.repo <<-EOF
[dockerrepo]
name=Docker Repository
baseurl=https://yum.dockerproject.org/repo/main/centos/7
enabled=1
gpgcheck=1
gpgkey=https://yum.dockerproject.org/gpg
EOF

$ yum install docker-engine

$ chkconfig docker on

$ service docker start


Create a linux group named docker and add your user to it, this will enable you to run Docker commands without using sudo

$ usermod -aG docker afryer

Install wget and curl packages

$ yum install wget
$ yum install curl-devel

Download the latest ChefDK and install


$ rpm -Uvh chefdk-0.10.0-1.el7.x86_64.rpm

Install the kitchen-docker ruby gem, switch to the user you will use for developing the Chef Cookbook and execute the following:

$ chef gem install kitchen-docker 


 Creating the Application Cookbook

Let’s create a simple application cookbook for a simple webserver configuration that uses the Apache2 cookbook from the Chef Supermarket to install Apache.

Switch to the user that you will use for creating the application cookbook and create the folder ~/chef-repo, this will be used as the local Chef repository for the source files for the application cookbook.
~$ mkdir -p ~/chef-repo

The chef executable is a command-line utility that comes as part of the ChefDk we will use this to generate the Chef Source code for the Application Cookbook.  

Create the c2b2_website application cookbook by executing the following commands:

$ cd ~/chef-repo
$ chef generate app c2b2_website

This generates the following folder structure which includes a top level Test Kitchen instance for testing the cookbook.

/c2b2_website
   /.git   
   /cookbooks      
      /c2b2_website         
         /recipes            
            default.rb         
         /spec            
            /unit               
               /recipes                  
                  default_spec.rb            
            spec_helper.rb         
         Berksfile         
         chefignore         
         metadata.rb   
   /test      
      /integration         
         /default            
            /server_spec               
               default_spec.rb         
            /helpers            
               /server_spec               
                  spec_helper.rb   
   .gitignore   
    README.md   
   .kitchen.yml

Let’s create a new recipe for the application cookbook named intsallapache, this will reference the appropriate recipes in the Apache2 cookbook to install Apache.  

First we need to set up the dependency to this cookbook in the metadata.rb file for the c2b2_website cookbook, add the following to the file ~/chef-repo/c2b2_website/cookbook/c2b2_website/metadata.rb:

depends 'apache2'

Test Kitchen uses Berkshelf for cookbook dependency management, so to run the integration tests we need to create the configuration file in the folder ~/chef-repo/c2b2_website/Berksfile and reference the Apache2 cookbook and the c2b2_website cookbook.  

Create the file ~/chef-repo/c2b2_website/Berksfile and add the following content:

source 'https://supermarket.chef.io'

cookbook 'apache2', '~> 3.1.0'

Dir['/home/username/chef-repo/c2b2_website/cookbooks/**'].each do |path|
  cookbook File.basename(path), path: path
end

The Apache2 cookbook installs Apache as a Linux service, as Docker by default does not run services we need to disable the creation of the service and create a recipe to start Apache.

Fortunately, the default recipe will only create the service if the only_if condition defined in the service resource block succeeds. The only_if condition runs the httpd binary with the -t switch which performs a syntax check on the Apache configuration, where the binary name is defined in the node attribute node[‘apache’][‘binary’].  

We can use this to our advantage by creating an attribute in our cookbook to override the default value set in the Apache2 cookbook, and set the value to ‘httpd -‘.  This will cause the condition to fail, hence preventing Apache from being installed as a service.

Create an attribute file named default using the ‘chef generate attribute’ command:

$ cd ~/chef-repo/c2b2_website
$ chef generate attribute cookbooks/c2b2_website default

add the following content to the file

default['apache']['binary'] = '/usr/sbin/httpd - '

Create a recipe named startapacheusing the ‘chef generate recipe’ command:

$ cd ~/chef-repo/c2b2_website
$ chef generate recipe cookbooks/c2b2_website startapache

Add the following content to start Apache

execute 'start_apache' do
  command 'httpd -k start'
  user 'root'
  group 'root'
  action :run
end

Create the recipe installapache:

$ cd ~/chef-repo/c2b2_website
$ chef generate recipe cookbooks/c2b2_website installapache

add the following content to include the default recipe from the Apache2 cookbook which installs a basic Apache configuration and the recipe from this cookbook to start Apache: 

include_recipe 'apache2::default'
include_recipe 'c2b2_website::startapache'

Configure Test Kitchen (Docker)

Now let’s configure Test Kitchen to use provision a Docker image based on Centos 7, update the file .kitchen.yml file with the contents below, see for more information https://github.com/spheromak/kitchen-docker/blob/master/README.md:

---
driver:
  name: docker
  binary: docker
  use_sudo: false

provisioner:
  name: chef_solo
  environments_path: environments
  coobooks_path:
    - cookbooks

  ohai:
    disabled_plugins: ["passwd"]

platforms:
  - name: centos-7
    driver_config:
      privileged: true
      memory: 1512m
      volume:
        - /sys/fs/cgroup:/sys/fs/cgroup:ro
      provision_command:
        - echo "root:password" | chpasswd
        - sed -i 's/Defaults    requiretty/#Defaults    requiretty/g' /etc/sudoers
suites:
  - name: default
    run_list:
      - recipe[c2b2_website::installapache]

Test Kitchen


Test Kitchen can be run in different modes of operation are:

CommandDescription
kitchen createCreates one or more instances configured in the .kitchen.yml file
kitchen convergeConverging the vm(s) with the configured Chef policy (cookbooks, roles, environment and data bags)
kitchen destroyDestroys the instance and deletes all information for the instance
kitchen list
List on or more instances and their state (Created, converged, Verified)
kitchen login

kitchen verify
Run the test suite(s) configured in the.kitchen.yml file on one or more instances
kitchen test
Test (destroys, creates, converges, verifies and destroys) one or more instances


If we now run ‘kitchen converge’, a Centos 7 Docker instance is created and Chef Solo used to converge the instance, running the c2b2_website cookbook, installing and starting Apache.  


We can check that Apache is installed and running by logging to the Docker instance and executing ps -ef | grep httpd to check that the process is running:


$ kitchen login
$$$$$$ Running legacy login for 'Docker' Driver
[kitchen@6c610c7ab9ce ~]$ ps -ef | grep httpd
root       512     1  0 17:32 ?        00:00:00 httpd -k start
apache     513   512  0 17:32 ?        00:00:00 httpd -k start
apache     514   512  0 17:32 ?        00:00:00 httpd -k start
apache     515   512  0 17:32 ?        00:00:00 httpd -k start
apache     516   512  0 17:32 ?        00:00:00 httpd -k start
apache     517   512  0 17:32 ?        00:00:00 httpd -k start
apache     518   512  0 17:32 ?        00:00:00 httpd -k start
apache     519   512  0 17:32 ?        00:00:00 httpd -k start
apache     520   512  0 17:32 ?        00:00:00 httpd -k start
apache     521   512  0 17:32 ?        00:00:00 httpd -k start
apache     522   512  0 17:32 ?        00:00:00 httpd -k start
apache     523   512  0 17:32 ?        00:00:00 httpd -k start
apache     524   512  0 17:32 ?        00:00:00 httpd -k start
apache     525   512  0 17:32 ?        00:00:00 httpd -k start
apache     526   512  0 17:32 ?        00:00:00 httpd -k start
apache     527   512  0 17:32 ?        00:00:00 httpd -k start
apache     528   512  0 17:32 ?        00:00:00 httpd -k start
kitchen    559   536  0 17:41 pts/0    00:00:00 grep --color=auto httpd
[kitchen@6c610c7ab9ce ~]$


There you have it, a way to develop and provision Chef cookbooks to Docker instance running in this case Centos 7.  In the next blog I’ll take this a step further and add integration tests to Test Kitchen to validate the Apache installation.


Spring Boot as a Microservice Platform

$
0
0


We are starting to see quite a few customers using or evaluating Spring Boot as a platform for their microservice applications, and as it is a platform we haven't discussed in any detail on this blog, I felt it was about time.

What is Spring Boot?

Spring Boot is a framework that pulls together a number of common application frameworks (mostly the various spring frameworks) for writing enterprise Java code, providing a quick way to write an enterprise application and deploy it as a single executable jar. Key to this single jar deployment is the fact that it can contain an embedded Tomcat (or Jetty) web container so that your jar doesn't need to be deployed into an external container.

Inverted containers

There has  been some talk about how platforms like Spring Boot make application servers or traditional containers irrelevant, and this is very much not the case. What Spring Boot does is take a Java EE 6 Web profile container and package it inside your application jar file, together with code to bootstrap the container, and servlets to call your code when the URL's you specified are requested. The only real change is that you package your container inside your application, rather than deploying your application to the container. Containers are not defined by how applications are deployed to them, but by the services that they provide, such as HTTP request handling, thread management, and component lifecycle management. There is very much still a need for containers to exist and continue to provide these services, although we may see them adapt to be more embeddable frameworks than deployment containers.

The relevance of Spring Boot to microservice architectures.

Spring Boot is an attractive platform for a project based on a microservice architecture for a number of reasons.
  • It includes all the frameworks necessary to rapidly develop RESTful and REST-like services
  • Its simple deployment (just run the jar file) makes it perfect for an architecture where rapid scaling up or down of a service may be required.
  • Being based on the Spring framework, it will already be familiar to many developers.
  • It's lightweight approach is well suited to building small lightweight services that individually have few dependencies.
  • It has good integration with Docker.
These all add up to make it an attractive choice when looking to build a lightweight and tight-scoped service that implements a part of your microservice architecture. There are situations when it is not quite as suitable as using a container with more features, but one of the advantages of a microservice architecture is that not all of your services need to be implemented using the same technologies.

A simple Spring Boot microservice example.

To demonstrate how simple it is to write a microservice with Spring Boot, lets create a complete example. We will build the following structure:


springboot-microservice
                      |
                      |-pom.xml
                      |
                      |-src/main/java
                                    |
                                    |-hello
                                          |
                                          |-Application.java
                                          |-HelloController.java
                                          |-HelloResponse.java


We start with a Maven POM, derived from the example in the Spring Boot get started example.

<?xml version="1.0"encoding="UTF-8"?>

<project
xmlns="http://maven.apache.org/POM/4.0.0"xmlns:xsi="http://www.w3.org/2001/XMLSchema-instance"

   
xsi:schemaLocation="http://maven.apache.org/POM/4.0.0 http://maven.apache.org/xsd/maven-4.0.0.xsd">

    <modelVersion>
4.0.0</modelVersion>


    <groupId>
com.c2b2</groupId>

    <artifactId>
springboot-microservice</artifactId>

    <version>
0.1.0</version>


    <parent>

        <groupId>
org.springframework.boot</groupId>

        <artifactId>
spring-boot-starter-parent</artifactId>

        <version>
1.3.2.RELEASE</version>

    </parent>


    <dependencies>

        <dependency>

            <groupId>
org.springframework.boot</groupId>

            <artifactId>
spring-boot-starter-web</artifactId>

        </dependency>

<!--        <dependency>

            <groupId>org.springframework.boot</groupId>

            <artifactId>spring-boot-starter-jetty</artifactId>

        </dependency> -->

   
</dependencies>


    <properties>

        <java.version>
1.8</java.version>

    </properties>


    <build>

        <plugins>

            <plugin>

                <groupId>
org.springframework.boot</groupId>

                <artifactId>
spring-boot-maven-plugin</artifactId>

            </plugin>

        </plugins>

    </build>


</project>

Our POM defines a single dependency, on the spring-boot-starter-web artifact. Note the commented out dependency on Jetty, uncommenting this will cause Spring Boot to package Jetty as an embedded container within our application, rather than Tomcat (the default). I left this in just to demonstrate how easy it is to switch between the two containers, it is not directly relevant for our example.

Next we need an application class, this class should have a main method, and Spring Boot will detect this and make it the entry point to our application. This class will be configured as the entry point when we execute our packaged jar file.

package hello;


import
java.util.Arrays;


import
org.springframework.boot.SpringApplication;

import
org.springframework.boot.autoconfigure.SpringBootApplication;

import
org.springframework.context.ApplicationContext;


@SpringBootApplication

public class Application {


public static void main(String[] args) {

        ApplicationContext ctx = SpringApplication.run(Application.
class, args);

   
}


}

This class only does one thing, which is bootstrap itself as a Spring application. This will cause the spring bootstrap framework to find our other classes annoted with relevant applications, and make them available.

We also need an HTTP endpoint, we could have this in the main application class, but this makes the example a little contrived, so instead we will have our endpoint in a separate class.

package hello;


import
org.springframework.web.bind.annotation.ResponseBody;

import
org.springframework.web.bind.annotation.RestController;

import
org.springframework.web.bind.annotation.RequestMapping;


@RestController

public class HelloController {


@RequestMapping("/")

   
@ResponseBody

   
public HelloResponse index() {

        HelloResponse response =
new HelloResponse();

       
response.setWho("Matt");

       
response.setWhat("Hello");

       
response.setWhere("World");

        return
response;

   
}


}

This class uses the @RestController annotation to define itself as a restful endpoint handler, and the @RequestMapping and @ResponseBody specify that the index() method should handle requests that come to the URL /, and that the return value of the method should be bound as the response body.

Our class constructs a simple POJO as the response, and that pojo is defined below:

package hello;


/**

 * Created by matt on 29/01/16.

 */

public class HelloResponse {

   
public String who;

    public
String what;

    public
String where;


    public
String getWhere() {

       
return where;

    
}


public void setWhere(String where) {

       
this.where = where;

   
}


public String getWho() {

       
return who;

   
}


public void setWho(String who) {

       
this.who = who;

   
}


public String getWhat() {

       
return what;

    
}


public void setWhat(String what) {

       
this.what = what;

   
}


}

Note that there is nothing in this class except three variables and their getters and setters. We are leaving it completely up to Spring Boot to map that to the response.

We can build this application using the command
$mvn package

This will build a jar file called springboot-microservice-0.1.0.jar in target, which we can execute with:
$java -jar target/springboot-microservice-0.1.0.jar

You will see Spring Boot start up
  .   ____          _            __ _ _
 /\\ / ___'_ __ _ _(_)_ __  __ _ \ \ \ \
( ( )\___ | '_ | '_| | '_ \/ _` | \ \ \ \
 \\/  ___)| |_)| | | | | || (_| |  ) ) ) )
  '  |____| .__|_| |_|_| |_\__, | / / / /
 =========|_|==============|___/=/_/_/_/
 :: Spring Boot ::        (v1.3.2.RELEASE)

2016-01-29 11:11:30.591  INFO 4648 --- [           main] hello.Application                        : Starting Application v0.1.0 on matt-virtual-machine with PID 4648 (/home/matt/springboot/gs-spring-boot/initial/target/springboot-microservice-0.1.0.jar started by matt in /home/matt/springboot/gs-spring-boot/initial)
2016-01-29 11:11:30.595  INFO 4648 --- [           main] hello.Application                        : No active profile set, falling back to default profiles: default
2016-01-29 11:11:30.674  INFO 4648 --- [           main] ationConfigEmbeddedWebApplicationContext : Refreshing org.springframework.boot.context.embedded.AnnotationConfigEmbeddedWebApplicationContext@655deae9: startup date [Fri Jan 29 11:11:30 GMT 2016]; root of context hierarchy
.
.
.


You can then open a second command prompt, and send a request to http://localhost:8080/ to see the response come back.

$curl http://localhost:8080/
{"who":"Matt","what":"Hello","where":"World"}

Note that the response comes back as JSON, Spring Boot will automatically determine how to map your response object based on the accepted content types specified in the request.

What about Configuring the container.

One of the key issues with embedding your container inside your application, is that it becomes a bit harder to make configuration changes to the container. The normal way you would configure Tomcat, via editing the server.xml file, is no longer available to you. Some of the properties, such as JVM memory pool sizes and garbage collector settings, you just set on the command line that you use to execute your jar file as you would for any JVM property. Other settings such as the port and address that Tomcat listens on are slightly more complex, but for most of the common properties, Spring Boot gives us a number of approaches. The easiest approach is to include an application.properties file within your application jar file. Spring Boot will find this, and it can be used to configure a large number of commonly used settings in the various frameworks and containers that make up Spring Boot. For example to set the IP address that we want our embedded Tomcat to listen on, we would create an application.properties file, and include the following properties:

server.port=8081

server.address=127.0.0.1

which properties are available in application.properties depends on which frameworks and containers you are using in your Spring Boot application, but a good reference of many of the common ones can be found here:


Conclusion

Hopefully this blog has given you an overview of why people are choosing Spring Boot as a platform for their microservice application, and shown you how simple it is to get started. Despite the simplicity of getting started with Spring Boot, it still needs just as much tuning and configuration as running any other web container or framework. In the next blog in this series, we will look at some of those tuning and configuration options in more detail.


Infinispan 8 Tour

$
0
0
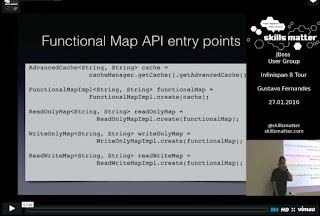
Last Wednesday, the 27th of January, C2B2 Consulting, together with Skills Matter CodeNode, once again hosted a London JBoss User Group event.

This time, we explored Infinispan 8, guided by Gustavo Fernandes from Red Hat's Infinispan team.

Infinispan 8 is the first version based on Java 8, and it brings many major features that take full advantage of the novelties introduced by the language, such as Lambdas, Streams and Completable Futures. It also introduces a brand new administration console, along with many query advanced capabilities and integration with the latest data processing tools.
Gustavo's talk showcased Infinispan 8 exciting new features with code samples and demos.

Click the image to see 'Infinispan 8 Tour' video presentation

Join London JBoss User Group on Meetup to make sure you won't miss any of our future events!

JBoss Logging and Best Practice for EAP 6.4 (Part 1 of 3)

$
0
0
By Brian Randell

If you’ve ever treated logging as an afterthought, or only given it serious consideration when the actual troubleshooting begins, this three-part guide will give you everything you need to implement a JBoss EAP 6.4 production logging configuration from the word go. Written from an administrator point of view, I’ll take you step-by-step through the best practices for your production environment and make troubleshooting a far easier proposition!


Logging is crucial to your environment; it can assist you greatly in understanding your system, helps detail items that are either a cause for concern now, or that might be in the future, and is a perfect tool for root cause analysis if fatal errors occur. Because of this you need log files that are readable, clean, and show what is useful to see. I have seen lots of JBoss log files where the log is spewing out so many errors with full stack traces and thousands upon thousands of INFO messages, that your ability to find the actual nub of the problem takes a lot of time - if you can decipher the log at all!

So, here are some questions to ask about logging:
  • What do we get out of the box in EAP 6.4?
  • How can we configure it?
  • What do we need in our Production environments?
  • What do we need to ask of our developers?

A lot of the decisions you make here will be specific to your environment. For example, how critical the applications are, your monitoring configuration, and the ease of troubleshooting are key to how you want your logging to be configured. These are decisions only you can make about the environment you administer and support.

For this article, I will be looking at JBoss EAP 6.4.0 running on CentOS 7.1.1503 and as such, this post will take a Linux slant. The reason I am using 6.4.x is that there are a few enhancements to the logging introduced in this version that I wanted to include.

Note: When I use $JBOSS_HOME I mean the directory in which JBoss is installed.

Note: When I use $JBOSS_LOG_DIR I mean the directory in which the logs are being stored. For Standalone this is usually in $JBOSS_HOME/standalone/logs. For Domain mode this will be in $JBOSS_HOME/domain/logs for the process controller and host logs, and $JBOSS_HOME/domain/server/<server>/logs for the server log.


Out of the box

As of JBoss EAP 6.4.0 the following logging is set by default:


GC Log

For a standalone server GC logging is enabled and is defined in:


$JBOSS_HOME/bin/standalone.sh


The following options are given to the JVM:

-verbose:gc –Xloggc:”$JBOSS_LOG_DIR/gc.log” –XX:+PrintGCDetails –XX:+PrintGCDateStamps –XX:+UseGCLogFileRotation –XX:NumberOfGCLogFiles=5 –XX:GCLogFileSize=3M –XX:-TraceClassUnloading


For a domain server GC logging is not enabled for the Process Controller, Host Controller or the Servers. You will need to enable these yourself through JVM properties on the Domain Controller for the level you want (i.e. Server level, Server Group level, Host level, Domain level)

Boot Log
For a standalone server the boot log file is defined as:

-Dorg.jboss.boot.log.file=$JBOSS_HOME/standalone/server/server.log

This is specified in the standalone.sh file but is also defined in the logging.properties file.

For a domain server the boot log file is defined as going to a different log depending on the process running.

For the Process Controller it is:

-Dorg.jboss.boot.log.file=$JBOSS_LOG_DIR/process-controller.log

For the Host Controller it is:

-Dorg.jboss.boot.log.file=$JBOSS_LOG_DIR/host-controller.log

This is specified in the domain.sh file but also in the logging.properties file.

Logging.properties
The logging.properties file provides the configuration definitions.

For a standalone server the logging.properties file is defined as:

-Dlogging.configuration=file:/$JBOSS_HOME/standalone/configuration/logging.properties

This is specified in the standalone.sh file

The logging.properties file for the standalone server contains the default information as to what is being logged, telling us the log categories configured and their log levels, the handler configurations and any formatters.

It is the logging.properties file that defines the FILE handler as going to:

$JBOSS_HOME/standalone/log/server.log

...and the CONSOLE handler as going to: 

SYSTEM_OUT

The logging properties file for a domain server is in:

$JBOSS_HOME/domain/configuration/logging.properties

This is specified in the domain.sh

This file contains boot logging configuration only for the Process Controller and the Host Controller.

There is a default server configuration file (which is the same as the standalone logging.properties file) in:

$JBOSS_HOME/domain/configuration/default-server-logging.properties

NOTE: The logging.properties file is only active until the logging subsystem is loaded.  You will notice by looking at the logging subsystem in the standalone.xml or the domain.xml that it is the same configuration as you see in the logging.properties file.

Console Log
The Console Log is used when running the scripts in $JBOSS_HOME/bin/init.d which are used when installing JBoss as a service, otherwise it logs to the screen if you are running JBoss from the standalone.sh or domain.sh scripts.

Both the jboss-as-domain.sh and jboss-as-standalone.sh files define the console log to be stored in:

/var/log/jboss-as/console.log

Log Levels
Whilst JBoss supports all log levels there are 6 main ones that get used (This information is taken from the Admin and config guide).

Log Level
Description
TRACE
Used for messages providing detailed information about the running state of an application
DEBUG
Used for messages that indicate the progress of individual requests or activities of an application.
INFO
Used for messages that indicate the overall progress of an application.
WARN
Used to indicate a situation that is not in error but is not considered ideal.  May indicate circumstances that may lead to errors in the future.
ERROR
Used to indicate an error that has occurred that could prevent the current activity or request from completing but will not prevent the application running
FATAL
Used to indicate events that could cause critical service failure.

NOTE: VERBOSE is not a log level that JBoss supports.

JBoss CLI Logging

By default the JBoss CLI logging is turned off. The configuration for this is in:

$JBOSS_HOME/bin/jboss-cli-logging.properties


Summary
So, to sum up the first of my blogs about JBoss logging, I have looked at the default configuration we have when first installing JBoss. The second part will look at  how we can configure the logging from these default settings, and then I’ll examine some best practice in the final article.


References


Using the Vagrant-Env Plugin for AWS Collaboration

$
0
0

by Mike Croft

I've been gradually integrating Vagrant into my workflow for a while now. I love how it gives me the chance to try something totally new out in a completely separated environment that I can then just bin if I get it all wrong - and I know that nothing in my host system has been contaminated. Docker can achieve basically the same thing, but Vagrant fits my workflow very well.
Vagrant is quite extensible and has plugins for VMWare, Microsoft Azure and Amazon Web Services as well as the default VirtualBox, so the same provisioning script can be used among your development team as well as in production in the cloud or on your self-hosted VMWare platforms. The only thing you'll need to keep the same is the OS that you want to provision - configured by Vagrant boxes.

Switching from VirtualBox to AWS

I've recently needed to use the AWS plugin for a talk for the West Midlands JUG in a demo, and this presented me with a problem. The example in the README of the Vagrant plugin looks like this:
Vagrant.configure("2")do|config|
config.vm.box="dummy"

config.vm.provider:awsdo|aws,override|
aws.access_key_id="YOUR KEY"
aws.secret_access_key="YOUR SECRET KEY"
aws.session_token="SESSION TOKEN"
aws.keypair_name="KEYPAIR NAME"

aws.ami="ami-7747d01e"

override.ssh.username="ubuntu"
override.ssh.private_key_path="PATH TO YOUR PRIVATE KEY"
end
end
For anyone reading this who is not familiar with AWS, the two important bits to note are the aws.access_key_id and aws.secret_access_key. If the word "secret" wasn't enough to tell you it shouldn't really be shared freely on Github, the reason you shouldn't be spreading that around is that that ID/Key pair gives anyone with those access to your Amazon account. They can be revoked very easily, but it's absolutely not the sort of security breach you want.
So now, the Vagrantfile which previously enabled us to share specific configurations among our teams and the community can now no longer be shared. Which is certainly a problem, when that is precisely the reason why you want to use it!

Enter the Vagrant-Env Plugin

Ideally, what I wanted to do was to be able to use placeholder variables that I could store in a separate file added to my .gitignore file. Then, I could just reference these variables and be confident that they wouldn't be uploaded to a public Github repository.
What I found was the vagrant-env plugin, which does exactly what I wanted:
Vagrant.configure("2")do|config|
config.vm.provider:awsdo|aws,override|
aws.access_key_id=ENV['AWS_ACCESS_KEY']
aws.secret_access_key=ENV['AWS_SECRET_KEY']
end
end
After making sure the plugin was installed:
$ vagrant plugin install vagrant-env
I added the actual values in a file called .env and then added that to my .gitignore. The README for the plugin does say that you need to specifically enable the plugin with config.env.enable in the Vagrantfile, but I left that out and found that it still worked fine.
I haven't used Microsoft Azure, yet, but I would expect a similar use case would require the use of the vagrant-env plugin, but in any case, the plugin is incredibly versatile, despite how simple it is.

Using X-Forwarded Proto to troubleshoot GlassFish and Apache Protocols

$
0
0
by Claudio Salinitro

C2B2 consultant, Claudio Salinitro looks at a GlassFish configuration solution implemented for a client suffering from HTTP timeout errors. Using X-Forwarded Proto to troubleshoot the protocols being used by the Apache web server and the GlassFish application server.

GlassFish Troubleshooting - C2B2


The Case

One of our clients recently got in touch with me after changing the Apache proxy connector to use HTTP instead of the AJP protocol, and found that they were experiencing repeated HTTP request timeout errors. Tracking the requests made by the browser, it was evident that these requests were trying to connect to the application in HTTP instead HTTPS - and the HTTP port was not open on the firewall.


Architecture

To understand the issue resolution, it is important to understand the underlying architecture…

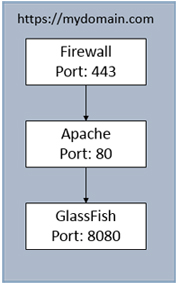
Removing all the components not relevant to understanding the issue, the architecture was basically composed of a Firewall as entry point for the clients with SSL termination, an Apache Web server acting as a reverse proxy, and a GlassFish application server.


GlassFish Architecture - C2B2


The problem

When an application on the server side has to build an URI, if not instructed otherwise, it will use the same protocol used by the application server (GlassFish). In this case, the protocol used by the client (https) is different to the one used by GlassFish (http), and this explains why the redirects sent by GlassFish were built with the wrong scheme.

Replicating the environment

The safest way to understand the problem and find a solution was to replicate it on a local environment where I could 'play around' and try different solutions.

For this purpose, I used a virtual machine with HAProxy as a substitute for the firewall, and a virtual machine with Apache Web server and GlassFish.

Step 1: Create the HTTPS certificate
I configured HAProxy with a self-generated certificate to use HTTPS:


openssl req -new -x509 -days 1460 -keyout server.key -out server.crt -nodes
cat server.crt server.key > serverHA.pem


Note: HAProxy requires the public and private key to be in a single PEM file. For this reason, I merged the two keys in a single serverHA.pem file.

Step 2: HAProxy configuration
I added the following to the haproxy.cfg configuration file:


frontend localhost
bind *:443 ssl crt /apps/httpd/conf/serverHA.pem
mode http
default_backend nodes

backend nodes
mode http
server web01 192.168.204.130:80


I bind to the port 443, presenting the self-generated certificate, and proxy all the requests to the Apache listening on the IP 192.168.204.130 port 80.

Step 3: Apache configuration

I added the following to the httpd.conf configuration file:


ProxyPass /clusterjsp http://127.0.0.1:8080/clusterjsp
ProxyPassReverse /clusterjsp http://127.0.0.1:8080/clusterjsp


Here I reverse proxy all the requests starting with /clusterjsp (our test web application) to GlassFish (on the same node, listening on port 8080)

Step 4: Test application
I used a test web application (clusterjsp) and added two jsp. The first, index.jsp, is the landing page and contains only the link to a second page, redirectBack.jsp. This will redirect back to the index using HttpServletResponse.sendRedirect to build the URI.

index.jsp:

<html>
<head><title>Test page</title></head>
<body>
<a href='redirectBack.jsp'>redirect</a>
</body>
</html>


redirectBack.jsp:


<% response.sendRedirect("index.jsp"); %>


I deployed the war file on a GlassFish instance listening in http on port 8080.

Going to the https://mydomain/clusterjsp/index.jsp page and clicking the 'redirect' link, I experienced exactly the same behaviour as our client:


Solution

To resolve the issue we have to tell GlassFish which protocol is used externally on the firewall - the de-facto standard being to use the HTTP header X-Forwarded-Proto.

For this purpose, we need to:

1.Set the header in Apache (using mod_headers)
2.Tell GlassFish which header is bringing the scheme information.


C2B2 - Delivering GlassFish Solutions


Step 1: Apache configuration
I modified the httpd.conf as below:


RequestHeader set X-Forwarded-Proto "https"
ProxyPreserveHost On

ProxyPass /clusterjsp http://127.0.0.1:8080/clusterjsp
ProxyPassReverse /clusterjsp http://127.0.0.1:8080/clusterjsp


The first directive adds the HTTP header X-Forwarded-Proto with the value “https”.

The second directive will pass the Host: line from the incoming request to the proxied host, instead of the hostname specified in the ProxyPass line.

Step 2: GlassFish configuration
Using asadmin we set the scheme mapping for the http connector of the GlassFish instance serving the web application:


asadmin set server.network-config.protocols.protocol.http-listener-1.http.scheme-mapping=X-Forwarded-Proto


The same setting can be applied using the GlassFish admin web interface in the settings for the HTTP protocol of the connector.

Testing once again using our test web application, I can see that I now have the correct behaviour!


Oracle WebLogic Work Managers - A Practical Overview

$
0
0
by Andy Overton

In this post, Andy Overton presents an insight into Oracle WebLogic Work Managers, going through the basics of what they are, how they are used, and providing deeper configuration and deployment advice. Using a test project, he examines the practical application of work managers, and looks at the control you can get over request handling and prioritisation.


How to configure and test WebLogic Work Managers


Overview

So, first of all, what are Work Managers?

Prior to WebLogic 9, Execute Queues were used to handle thread management. You created thread-pools to determine how workload was handled. Different types of work were executed in different queues based on priority and order requirements. The issue was that it is very difficult to determine the correct number of threads required to achieve the throughput your application requires and avoid deadlocks.

Work Managers are much simpler. All managers share a common thread pool and priority is determined by a priority-based queue. The thread pool size is dynamically adjusted in order to maximise throughput and avoid deadlocks. In order to differentiate and prioritise between different applications, you state objectives via constraints and request classes (e.g. fair share or response time). 

More on this later!


Why use Work Managers?

If you don’t set up your own Work Managers, the default will be used. This gives all of your applications the same priority and they are prevented from monopolising threads. Whilst this is often sufficient, it may be that you want to ensure that:

  • Certain applications have higher priority over others.
  • Certain applications return a response within a certain time.
  • Certain customers or users get a better quality of service.
  • A minimum thread constraint is set in order to avoid deadlock.


Types of Work Manager

  • Default– Used if no other Work Manager is configured. All applications are given an equal priority.
  • Global– Domain-scoped and are defined in config.xml. Applications use the global Work Manager as a blueprint and create their own instance. The work each application does can then be distinguished from other applications.
  • Application– Application-scoped and are applied only to a specific application. Specified in either weblogic-application.xml, weblogic-ejb-jar.xml, or weblogic.xml.


Constraints and Request Classes

A constraint defines the minimum and maximum number of threads allocated to execute requests and the total number of requests that can be queued or executing before the server begins rejecting requests. Constraints can be shared by several Work Managers.

Request classes define how requests are prioritised and how threads are allocated to requests. They can be used to ensure that high priority applications are scheduled before low priority ones, requests complete within a given response time or certain users are given priority over others. Each Work Manager may specify one request class.


Types of Constraint

  • Max threadsDefault, unlimited.
    The maximum number of threads that can concurrently execute requests. Can be set based on the availability of a resource the request depends on e.g. a connection pool.
  • Min threads– Default, zero.
    The minimum number of threads to allocate to requests. Useful for preventing deadlocks.
  • Capacity– Default, -1 (never reject requests).
    The capacity (including queued and executing) at which the server starts rejecting requests.


Types of Request Class


  • Fair Share– Defines the average thread-use time. Specified as a relative value, not a percentage.
  • Response Time– Defines the requested response time (in milliseconds).
  • Context– Allows you to specify request classes based on contextual information such as the user or user group.


Initial Setup

For this blog the following versions of software were used:

  • Ubuntu 14
  • JDK 1.8.0_73
  • WebLogic Server 12.2.1
  • JMeter 2.13
  • NetBeans 8.1

So, first of all, install WebLogic and set up a very basic domain (test_domain) with just an Admin server.


Register the server with IDE:
  1. Open the Services window
  2. Right-click the Servers node and choose 'Add Server'
  3. Select Oracle WebLogic Server and click 'Next'
  4. Click 'Browse' and locate the directory that contains the installation of the server, then Click 'Next'. The IDE will automatically identify the domain for the server instance.
  5. Type the username and password for the domain.


Creating the test project


Select New Project: Java EE - Enterprise Application
Name: WorkManagerTest
Server: Oracle WebLogic Server

Under WorkManagerTest-war, right click 'Web Pages' and select 'New JSP'.
File Name: test.jsp


Change the body to:


<body>
<h1>Work manager test OK</h1>
<%
Thread.sleep(1000);// sleep for 1 second
%>
</body>

Right click on WorkManagerTest-war, select 'Deploy' and then go to: http://localhost:7001/WorkManagerTest-war/test.jsp where you should see your page displayed.

Now create another application, this time called WorkManagerTest-2. 
This will be identical to test 1 but change the JSP code to: Name - test-2.jsp


<body>
<h1>Work manager test 2 OK</h1>
<%
Thread.sleep(1000);// sleep for 1 second
%>
</body>


Go to the WebLogic console: http://localhost:7001/console


Go to Deployments - click on WorkManagerTest-war, select Monitoring, Workload. Here you can see the work managers, constraints and request classes associated with your application. As we haven’t yet set anything up the app is currently using the default Work Manager.


Creating the JMeter test

Right click on Test Plan and select Add Threads (Users) > Thread Group

Name: Work Manager Test
Number of Threads (users): 10
Ramp-Up Period (in seconds): 10

This will call your application once per second for 10 seconds.

Right click on your new Thread Group and select: Add > Sampler > HTTP Request

Name: test.jsp
Server Name: localhost
Port: 7001
Path: WorkManagerTest-war/test.jsp

Right click on Test - 10 users
Add, Listener, View Results in Table
Add, Listener, View Results Tree

Create another HTTP request as follows:
Name: test-2.jsp
Server Name: localhost
Port: 7001
Path: WorkManagerTest-2-war/test-2.jsp

Right click on Test - 10 users
Add, Listener, View Results in Table
Add, Listener, View Results Tree

Save your test plan and then run it.

Click on results tree and table. With tree, you can view request and response data; obviously not very interesting in our case, but handy if you want to see what's being returned from an app. More useful is View Results in Table. This is very handy for quickly seeing response times. You should see that each of your JSPs/applications was called 10 times and each time it took just over a second to return a response.


Creating the work managers

In the WebLogic admin console:


  • Environment: Work Managers
  • New: Work Manager
  • Name: WorkManager1
  • Target: AdminServer

Create another the same but name it 'WorkManager2'


Using Fair Share request classes

In the WebLogic admin console


  • Environment: Work Managers
  • New: Fair Share Request Class
  • Name: FairShareReqClass-80
  • Fair Share: 80
  • Target: AdminServer

Create another with name FairShareReqClass-20, Fair Share 20

Now we need to associate the request classes with the Work Managers.

  • Select WorkManager1, under Request Class select FairShareReqClass-80 and save.
  • Select WorkManager2, under Request Class select FairShareReqClass-20 and save.

For the changes to take effect you will need to restart the server.

Alter web.xml in both of the applications. This can be found under WEB-INF.

WorkManagerTest-war

Add:


<servlet>
<servlet-name>Test1</servlet-name>
<jsp-file>test.jsp</jsp-file>
<init-param>
<param-name>wl-dispatch-policy</param-name>
<param-value>WorkManager1</param-value>
</init-param>
</servlet>


WorkManagerTest-2-war


<servlet>
<servlet-name>Test2</servlet-name>
<jsp-file>test-2.jsp</jsp-file>
<init-param>
<param-name>wl-dispatch-policy</param-name>
<param-value>WorkManager2</param-value>
</init-param>
</servlet>


Now, when you run the JMeter test again, you should see results similar to the following:


What we are seeing is that test1.jsp is using the Work Manager with a Fair Share request class set to 80, whereas test2.jsp is using one set to 20.

There is an 80% (80/100) chance that the next free thread will perform work for jsp1. There is a 20% (20/100) chance it will next service jsp2.

As mentioned previously, the values used aren’t a percentage, although in our case they happen to add up to 100.

If you were to add another jsp, also using the Fair Share request class set to 20 the figures would be different: jsp1 would have a 66.6% chance (80/120), and jsp 2 and 3 would both have a 16.6% chance (20/120).


Using Response Time request classes


Next we will take a look at using response time request classes. There is no need to alter either JSP - we will just create new request classes and set our work managers to use those.

In the WebLogic console, go to Environment – Work Managers

  • Select New: Response Time Request Class
  • Name: ResponseTime-1second
  • Goal: 1000
  • Target: AdminServer

Create another but with the following values:

  • Name: ResponseTime-5seconds
  • Goal: 5000
  • Target: AdminServer

Finally, alter the two work managers:

Alter WorkManager1 to use the ResponseTime-1second response class and WorkManager2 to use the ResponseTime-5seconds response class.
Then restart the server.

Now, alter your JMeter test so that it loops forever.

Run it again and you should see that to begin with it takes a little while for the work managers to take effect. After a while, however you should see that the responses to both the apps start to even out and take around a second.

This is described in the Oracle documentation: “Response time goals are not applied to individual requests. Instead, WebLogic Server computes a tolerable waiting time for requests with that class by subtracting the observed average thread use time from the response time goal, and schedules requests so that the average wait for requests with the class is proportional to its tolerable waiting time.”


Context request classes

Context request classes are compound request classes that provide a mapping between the request context and a request class. This is based upon the current user or the current user’s group.

So it’s possible to specify different request classes for the same servlet invocation depending on the user or group associated with the invocation.

I won’t create one as a part of this blog as they simply utilise the other request class types.


Using constraints

Constraints define the minimum and maximum number of threads allocated to execute requests and the total number of requests that can be queued or executing before WebLogic Server begins rejecting requests.

As they can cause requests to be queued up or even worse, rejected, they should be used with caution. A typical use case of maximum threads constraint is to take a data source connection pool size as the max constraint. That way you don’t attempt to handle a request where a database connection is required but cannot be got.

There are 3 types of constraint:

  • Minimum threads
  • Maximum threads
  • Capacity
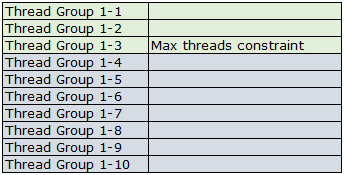
The minimum threads constraint ensures that the server will always allocate this number of threads,  the maximum threads constraint defines the maximum number of concurrent requests allowed, and the capacity constraint causes the server to reject requests when it has reached its capacity.

To see how this works in action, let’s create some constraints. 

Under Work Managers in the WebLogic console create the following, all targeted to the AdminServer:

New Max Threads Constraint:

  • Name - MaxThreadsConstraint-3
  • Count – 3

New Capacity Constraint:


  • Name - CapacityConstraint-10
  • Count 10

Next, create a new Work Manager called ConstraintWorkManager, add the two constraints to it and then restart WebLogic.

Now, alter the Test1 application and change the Work Manager in web.xml from WorkManager1 to ConstraintWorkManager. Also, alter the sleep time from 1 second to 5 and then re-deploy your application.

Next, create a new JMeter test with the following parameters:

  • Number of Threads (users) – 10
  • Ramp-Up Period – 0

Run this test and you should see results similar to the following:


So, what’s happening here?

(Remember, we set the maximum threads to 3). W
e send in 10 concurrent requests, and 3 of those begin to be processed immediately, whilst the others are put in a queue. So, we get the following:


At the start:


After 5 seconds:


After 10 seconds:


After 15 seconds:


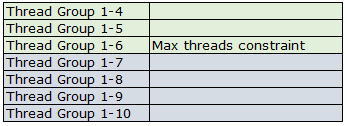
Next, change the JMeter test. Raise the number of users to 13 and run the test again. This time you will see that 3 of the requests fail. This is due to the Capacity Constraint being set to 10. This means that only 10 requests can be either processing or queued and the others are rejected.


If you call the application from your browser whilst the test is running you will see that you receive a 503--Service Unavailable error (this can be replaced with your own error page).

Take care when setting up thread constraints - you don’t want to be limiting what your server can process without good reason and you certainly don’t want to be rejecting requests without very good reason.

Conclusion

Hopefully, this overview of WebLogic Work Managers has given you an insight into what they are used for and how you can go about setting them up.

WebLogic does a good job of request handling itself out of the box but sometimes you will find that you need more control over which applications should take priority or what should happen in times of heavy load. 

In that case, Work Managers can prove very useful, although as with all such things – make sure you are certain of what you are trying to achieve, then test, test some more and then test again!

Knowing how you want your server to run and being sure how it is running are two very different things. Ensure you test for all potential loads and understand what will happen in all cases.


More popular WebLogic posts from our technical blog...


Installing WebLogic with Chef
Alan Fryer shows you how to create a simple WebLogic Cluster on a virtual machine with two managed servers using Chef.

Basic clustering with WebLogic 12c and Apache Web Server
Mike Croft demonstrates WebLogic’s clustering capabilities and shows you how to utilise the WebLogic Apache plugin to use the Apache Web Server as a proxy to forward requests to the cluster.


Alternative Logging Frameworks for Application Servers: WebLogic
Andrew Pielage  focuses on WebLogic, specifically 12c, and configuring it to use Log4j and SLF4J with Logback.


WebLogic 12c Does WebSockets - Getting Started
In this post, Steve demonstrates how to write a simple websockets echo example using 12.1.2


Weblogic - Dynamic Clustering in practice
In this blog post Andy looks at setting up a dynamic cluster on 2 machines with 4 managed servers (2 on each). He then deploys an application to the cluster and shows how to expand the cluster.


Getting the most out of WLDF Part 1: What is the WLDF?
The WebLogic Diagnostic Framework (WLDF) is an often overlooked feature of WebLogic which can be very powerful when configured properly.In this blog series, Mike Crosft points out some of the low-hanging fruit so you can get to know enough of the basics that you’ll be able to make use of some of the features, while having enough of a knowledge of the framework to take things further yourself.


JBoss Logging and Best Practice for EAP 6.4 (Part 2 of 3)

$
0
0
By Brian Randell

Following on from Brian's previous post in the series, which showed you the default logging configuration for JBoss EAP 6.4.0, this post takes a look at how you can configure some of the core components. I'll be taking a standard common approach for the configuration purposes of this post and will leave more advanced configuration for future posts.

For this post we will primarily look at the configuration for a standalone deployment.


Configuration

GC Log

The GC Log can be configured in the standalone.conf for standalone servers and in JVM properties for the domain servers.

For the standalone server these can be overridden as a whole by updating the JAVA_OPTS in the standalone.conf file.  (Note – you will need *all* the options you require)

The standalone.sh script checks for the presence of a ‘-verbose:gc’ entry in JAVA_OPTS.  So if this exists in the standalone.conf file then it will bypass the GC configuration in the standalone.sh.

An example additional line in the standalone.conf is :


#
# Specify options to pass to the Java VM.
#
if [ "x$JAVA_OPTS" = "x" ]; then
JAVA_OPTS="-Xms1303m -Xmx1303m -XX:MaxPermSize=256m -Djava.net.preferIPv4Stack=true"
JAVA_OPTS="$JAVA_OPTS -Djboss.modules.system.pkgs=$JBOSS_MODULES_SYSTEM_PKGS -Djava.awt.headless=true"
JAVA_OPTS="$JAVA_OPTS -Djboss.modules.policy-permissions=true"
JAVA_OPTS="$JAVA_OPTS -verbose:gc -Xloggc:/opt/jboss/jboss-eap-6.4/standalone/log/gctest.log -XX:+PrintGCDetails -XX:+PrintGCDateStamps -XX:+UseGCLogFileRotation -XX:NumberOfGCLogFiles=5 -XX:GCLogFileSize=3M -XX:-TraceClassUnloading"
else
echo "JAVA_OPTS already set in environment; overriding default settings with values: $JAVA_OPTS"
fi

Note: I have changed the name of the log to gctest.log.


We can then see these options shown in the process :


$ ps -ef | grep ja
jboss 4438 4355 16 10:42 pts/0 00:00:07 java -D[Standalone] -server -XX:+UseCompressedOops -Xms1303m -Xmx1303m -XX:MaxPermSize=256m -Djava.net.preferIPv4Stack=true -Djboss.modules.system.pkgs=org.jboss.byteman -Djava.awt.headless=true -Djboss.modules.policy-permissions=true -verbose:gc -Xloggc:/opt/jboss/jboss-eap-6.4/standalone/log/gctest.log -XX:+PrintGCDetails -XX:+PrintGCDateStamps -XX:+UseGCLogFileRotation -XX:NumberOfGCLogFiles=5 -XX:GCLogFileSize=3M -XX:-TraceClassUnloading -Dorg.jboss.boot.log.file=/opt/jboss/jboss-eap-6.4/standalone/log/server.log -Dlogging.configuration=file:/opt/jboss/jboss-eap-6.4/standalone/configuration/logging.properties -jar /opt/jboss/jboss-eap-6.4/jboss-modules.jar -mp /opt/jboss/jboss-eap-6.4/modules -jaxpmodule javax.xml.jaxp-provider org.jboss.as.standalone -Djboss.home.dir=/opt/jboss/jboss-eap-6.4 -Djboss.server.base.dir=/opt/jboss/jboss-eap-6.4/standalone


Boot Log

For this post, rather than show how to modify the boot logging, it is worth mentioning the new CLI command introduced in 6.4 – ‘read-boot-errors’.

This is part of the management core service and looks at the log, and reports back errors relating to the start of the server. This is very useful as it can be scripted using CLI to look at numerous servers and check them, pulling the information centrally.


To test this using the standalone server, I renamed the h2 directory so the server could not find the h2 module :


$ pwd
/opt/jboss/jboss-eap-6.4/modules/system/layers/base/com/h2database
$ mv h2 h2old


I then started the JBoss server and ran the cli command :


$ ./jboss-cli.sh --connect
[standalone@localhost:9999 /] /core-service=management:read-boot-errors
{
"outcome" => "success",
"result" => [
{
"failed-operation" => {
"operation" => "add",
"address" => [
("subsystem" => "datasources"),
("jdbc-driver" => "h2")
]
},
"failure-timestamp" => 1460370253333L,
"failure-description" => "JBAS010441: Failed to load module for driver [com.h2database.h2]"
},
{
"failed-operation" => {
"operation" => "add",
"address" => [
("subsystem" => "datasources"),
("data-source" => "ExampleDS")
]
},
"failure-timestamp" => 1460370254540L,
"failure-description" => "{\"JBAS014771: Services with missing/unavailable dependencies\" => [\"jboss.data-source.java:jboss/datasources/ExampleDS is missing [jboss.jdbc-driver.h2]\",\"jboss.driver-demander.java:jboss/datasources/ExampleDS is missing [jboss.jdbc-driver.h2]\"]}",
"services-missing-dependencies" => [
"jboss.data-source.java:jboss/datasources/ExampleDS is missing [jboss.jdbc-driver.h2]",
"jboss.driver-demander.java:jboss/datasources/ExampleDS is missing [jboss.jdbc-driver.h2]"
]
},
{
"failed-operation" => {
"operation" => "enable",
"address" => [
("subsystem" => "datasources"),
("data-source" => "ExampleDS")
]
},
"failure-timestamp" => 1460370254542L,
"failure-description" => "{\"JBAS014879: One or more services were unable to start due to one or more indirect dependencies not being available.\" => {\"Services that were unable to start:\" => [\"jboss.data-source.reference-factory.ExampleDS\",\"jboss.naming.context.java.jboss.datasources.ExampleDS\"],\"Services that may be the cause:\" => [\"jboss.jdbc-driver.h2\"]}}",
"missing-transitive-dependency-problems" => {
"Services that were unable to start:" => [
"jboss.data-source.reference-factory.ExampleDS",
"jboss.naming.context.java.jboss.datasources.ExampleDS"
],
"Services that may be the cause:" => ["jboss.jdbc-driver.h2"]
}
}
]
}

You can see the boot errors are shown and pinpoint the area you need to investigate.


Console Log

As mentioned in the previous post, the console log gets used by default when using the jboss-as-standalone.sh or jboss-as-domain.sh scripts.  The file is placed in the /var/log/jboss-as/ directory.

When setting up JBoss to run as a service you will use the jboss-as.conf script.  The easiest way to modify where the console log goes is to modify this script which feeds the configuration into the jboss-as-standalone.sh and jboss-as-domain.sh scripts.

Edit the jboss-as.conf file and uncomment the JBOSS_CONSOLE_LOG configuration, and modify as appropriate.

In my example below I have uncommented the line and changed the filename to test.log.


# General configuration for the init.d scripts,
# not necessarily for JBoss AS itself.

# The username who should own the process.
#
JBOSS_USER=jboss

# The amount of time to wait for startup
#
# STARTUP_WAIT=30

# The amount of time to wait for shutdown
#
# SHUTDOWN_WAIT=30

# Location to keep the console log
#
# JBOSS_CONSOLE_LOG=/var/log/jboss-as/console.log
JBOSS_CONSOLE_LOG=/var/log/jboss-as/test.log

When I now stop and start the service you can then see in my directory the new filename alongside the old.


# pwd
/var/log/jboss-as
# ll
total 16
-rw-r--r--. 1 root root 5679 Apr 11 12:28 console.log
-rw-r--r--. 1 root root 4776 Apr 11 12:35 test.log


Handlers

There are 7 types of Handlers you can create and you can create multiple handlers of each type. For this example we will create a new ‘Size’ Handler Type. We will do this through the CLI and see the results in the Console.

To start – our server is running and we have connected using the CLI. To add a new Handler we use the add command for the new handler name.  For the most part we will keep the default values :


[standalone@localhost:9999 /] /subsystem=logging/size-rotating-file-handler=NEWSIZE:add(file={"path"=>"newsize.log", "relative-to"=>"jboss.server.log.dir"},level="DEBUG",enabled=true, append=false, rotate-size=5m,max-backup-index=10,rotate-on-boot=true,suffix=".yyyy-MM-dd-HH")
{"outcome" => "success"}

We have created a handler called ‘NEWSIZE’ that will write to the file ‘newsize.log’ at DEBUG level and rotate if the file gets to 5Mb and keep a backup of 10 files.

We can check the values for the handler we have created :


[standalone@localhost:9999 /] /subsystem=logging/size-rotating-file-handler=NEWSIZE:read-resource
{
"outcome" => "success",
"result" => {
"append" => false,
"autoflush" => true,
"enabled" => true,
"encoding" => undefined,
"file" => {
"path" => "newsize.log",
"relative-to" => "jboss.server.log.dir"
},
"filter" => undefined,
"filter-spec" => undefined,
"formatter" => "%d{HH:mm:ss,SSS} %-5p [%c] (%t) %s%E%n",
"level" => "DEBUG",
"max-backup-index" => 10,
"name" => "NEWSIZE",
"named-formatter" => undefined,
"rotate-on-boot" => true,
"rotate-size" => "5m",
"suffix" => ".yyyy-MM-dd-HH"
}
}


In the Console we can see the Handler added :


We can see our new log created on the file system :


[root@localhost init.d]# ll /opt/jboss/jboss-eap-6.4/standalone/log/
total 156
-rw-rw-r--. 1 jboss jboss 1669 Apr 11 09:50 backupgc.log.current
-rw-rw-r--. 1 jboss jboss 1500 Apr 11 10:05 gc.log.0.current
-rw-rw-r--. 1 jboss jboss 1494 Apr 11 12:35 gctest.log.0.current
-rw-r--r--. 1 jboss jboss 0 Apr 11 12:59 newsize.log
-rw-rw-r--. 1 jboss jboss 133362 Apr 11 12:35 server.log
-rw-rw-r--. 1 jboss jboss 10419 Feb 4 19:50 server.log.2016-02-04

If we want to modify an entry we can use the write-attribute command. So if we want to change the size of the files to 10Mb we can use the following:


[standalone@localhost:9999 /] /subsystem=logging/size-rotating-file-handler=NEWSIZE:write-attribute(name=rotate-size,value=10m)

If we want to remove the handler entirely, we can use the remove command:

[standalone@localhost:9999 /] /subsystem=logging/size-rotating-file-handler=NEWSIZE:remove

Log Categories

You can define a log category against a particular handler and level of message you want to see. This is useful when troubleshooting if you know the area you want to analyse, and want to see a higher level of logging just for that area.

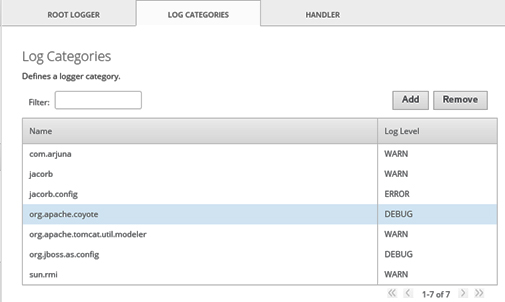
For this example we will add a log category for org.apache.coyote and attach it to our NEWSIZE handler we have just created.

To add a new log category we need to use the add command with the new category:


[standalone@localhost:9999 /] /subsystem=logging/logger=org.apache.coyote:add(category=org.apache.coyote,level=DEBUG,handlers=[NEWSIZE])
{"outcome" => "success"}
We can check the new category :
[standalone@localhost:9999 /] /subsystem=logging/logger=org.apache.coyote:read-resource
{
"outcome" => "success",
"result" => {
"category" => "org.apache.coyote",
"filter" => undefined,
"filter-spec" => undefined,
"handlers" => ["NEWSIZE"],
"level" => "DEBUG",
"use-parent-handlers" => true
}
}


We can see this new category in the console:


If we want to modify an entry we can use the write-attribute command.  So if we want to change the log level we can use the following:


[standalone@localhost:9999 /] /subsystem=logging/logger=org.apache.coyote:write-attribute(name=level, value=TRACE)

If we want to remove the handler entirely we can use the remove command:


/subsystem=logging/logger=org.apache.coyote:remove


CLI Logging

To log activity through the CLI and through the Console, you can easily enable the Management Interface logging using a CLI command.


[standalone@localhost:9999 /] /core-service=management/access=audit/logger=audit-log:write-attribute(name=enabled,value=true)

This produces a management audit log file created at $JBOSS_HOME/standalone/data/audit-log.log

You can also modify the $JBOSS_HOME/bin/jboss-cli-logging.properties file for just the CLI logging.  Change the log level to INFO and uncomment the handler.


# Additional logger names to configure (root logger is always configured)
loggers=org,org.jboss.as.cli
logger.org.level=OFF
# assign a lower level to enable CLI logging
logger.org.jboss.as.cli.level=INFO

# Root logger level
logger.level=${jboss.cli.log.level:INFO}
# Root logger handlers
# uncomment to enable logging to the file
logger.handlers=FILE

Once done and CLI restarted then the file jboss-cli.log will be created with CLI information stored.


Advanced Configuration

As mentioned earlier, there are a number of more advanced logging configurations that could be achieved. As these are less standard and commonplace, they have been left for future blog posts.
  • Logging Profiles and their Configuration
  • SysLog Handlers
  • Log Category Filtering
  • Asynchronous logging


Summary

To summarise this blog series so far: We have seen what the default logging configuration is in JBoss EAP 6.4.0 and now know how to reconfigure the most common aspects for different types of logging.

Part three will look at the recommendations for which configuration changes you should make.

JBoss EAP Logging - Part One


JBoss Logging and Best Practice for EAP 6.4 (Part 3 of 3)

$
0
0

by Brian Randell

So far in this series of posts about JBoss logging and best practice, we have seen what JBoss EAP 6.4.0 provides out of the box and how you might go about changing that configuration. As you may realise by now, there are a lot of areas you can configure and customise. This post takes a look at what you need to be thinking about when deciding what you want to implement in a production environment.

The areas I want to look at in this, the third and final part of the series are:
  • What we need in our Production environments?
  • What we need to ask of our developers?


Production Implementation

For a JBoss deployment to be production ready from a logging perspective we need to think about several key areas:
  • What areas are the priority for us to monitor
  • What housekeeping should be in place
  • What can we do to troubleshoot issues when they arise


Log monitoring

For most organisations monitoring solutions are in place that can be configured to connect to the server (usually through an agent,) read the log and alert on keywords such as ERROR and FATAL. You could also set up the monitoring solution to be more specific, and alert on certain phrases only.

It therefore makes sense for any JBoss server that the log being monitored by a monitoring solution is a single log that contains all messages for these log levels- and that can be easily parsed. From an administrative point of view this is also what I would want to see. One log that contains all I need to know about the current running of the system.

By default, when installing JBoss as a service we get two logs. We get a console log and a server log. The console log shows everything that has happened since the last restart, the server log shows everything that has happened. For me only one of these logs is required and it’s the server log.

This is the mainstay of your information about the system and should be the only one you need to worry about. So for me – I ignore and limit the information sent to the console log when running JBoss as a service, and concentrate on the server log.

Another thought here is to copy daily server logs to a central server. This can be useful if any trend analysis is required or if you are troubleshooting across a domain.

This may sound obvious, but as the monitoring will alert – the log needs to be clear of errors when you first start monitoring it in production. It is never sensible to start with errors already occurring.


Log housekeeping

If you do not have any log rotation or housekeeping and endlessly keep logs then eventually disk space will be an issue.

There is generally little point in keeping logs in production for more than 14 days and more often for more than 7 days.  If you are monitoring the system effectively then the alerts will be seen immediately and dealt with.  If any logs need to be kept for Problem Management or Root Cause Analysis scenarios then these can be moved away manually.

One thing to realise here is that if JBoss is running, then if you remove the active log file (moving it to an archive directory perhaps) it won’t automatically regenerate. The best practice is to copy it and empty it whilst in situ.

Luckily JBoss provides a number of different Log Handlers for us to use to make the housekeeping easy. There are several handlers that can be used to rotate the log on size or time. Now in 6.4 there is also a handler (Periodic Size) that can do either – and acts on whichever triggers the rotation first.


Log troubleshooting

If there is an issue on the server that we need to look into more closely then we have the ability to add specific log categories and raise the logging as we need them. This will take affect dynamically so we can turn up logging when the system is exhibiting a problem to troubleshoot and then turn it down when finished. This is particularly beneficial so that we do not swamp the logs with messages we don’t care about which can also cause performance headaches and could cause logs to increase in size substantially that could cause disk space issues.

We also have the potential here to log specific log categories to a different handler and hence a different log file so we can see our troubleshooting messages in a different file outside of the standard logging mechanism which then won’t interfere with normal monitoring.

Personally I like to troubleshoot against a separate debug log and have a Log Handler previously set up that I can utilise if and when required. This way you can place that log elsewhere, perhaps on a different file system or disk so it interferes less with the normal running of the system.

For this you would create a new Handler and use that handler for specific log categories when required.

See the examples In the previous blog in this series for how to create a handler and associate a log category with that handler.

For boot errors EAP 6.4.0 has a introduced a CLI command read-boot-errors.  It is a Management command and can be used to monitor the boot errors.

/core-service=management:read-boot-errors

This allows a script to be used to see if any boot errors have occurred.  Particularly useful if you are starting up a number of servers at the same time.


Other Logging

As we have seen in the previous posts in this series, the Management Interface Logging is turned off by default.
I like this to be turned on.  If you are running a large environment it provides another avenue for troubleshooting and auditing.  It could be that a problem occurred due to the wrong CLI command being issued.  This could have been ad hoc at the time or may be a script being run automatically. Hence to see all activity on the server at the time an issue may have occurred is invaluable.

Developer guidelines

When we talk about Log Levels (as defined previously) and the types of messages that should fall into each level it’s the developers that often don’t adhere quite as strictly as they should.
I am not a developer, but as an administrator who is the first point of call if issues are flagged in the log, I want to look at the logs on Jboss when an application is running and ask these questions :


How noisy is the log ?

Try the log at different log levels and see whether each level has what you would consider the right information for that level.  For example, do INFO messages look like they should be INFO or perhaps really be DEBUG ? 
I have seen many applications that are ‘noisy’ and that make the log virtually unreadable and very difficult to diagnose when issues are occurring.


Stack Traces

If Stack Traces are logged for an error – are they useful for the context of the error?

Stack Traces can be large so you don’t want too many of them cluttering your ability to read the log. You only want stack traces shown when there is an ERROR level message or at a TRACE level (and potentially DEBUG, though I would not like to see them at this level either). For INFO level messages there should be no need for Stack Traces.

We also need to see whether we are getting multiple Stack Traces for the same error at different levels of the stack. One error should only need one Stack Trace.

And finally on Stack Traces, are they necessary anyway? Can the ERROR description define the issue enough that you don’t need to see the entire Stack Trace.

Don’t be afraid to push these issues back to the developers to change. If it affects your ability to properly monitor and troubleshoot a production application then it isn’t production ready in my eyes.

Summary

Hopefully some aspects of this series of posts have given you pause for thought and helped you along your way for implementing a production logging configuration that provides an environment that is well monitored and has easier troubleshooting. JBoss has a lot of flexibility where monitoring is concerned and you can get lost in the plethora of options available.

My advice :  Keep it simple, straightforward and uncluttered. Let it work for you not against you.

References


Part OnePart Two


JBoss EAP 7 - A First Look

$
0
0
by Brian Randell


In this post, Brian Randell takes a peek at the new JBoss EAP 7.0.0 release and gives his impression as a JBoss consultant and administrator. He'll dig deeper under the cover and a throw little light on some of the new features and enhancements in future posts, but for his first look he'll reveal what he sees when getting it up-and-running for the first time.


The first version of JBoss EAP 7 was released on 10th May 2016 (Red Hat JBoss EAP 7.0.0). It's based on WildFly 10 (http://wildlfy.org/and uses Java SE 1.8 implementing Java EE 7 Full Platform and Web Profile Standards. The full list of supported configurations are listed here (please note that access requires a Red Hat subscription)https://access.redhat.com/articles/2026253 


...I could see a number of areas that were of immediate interest to me:

  • The replacement of HornetQ with Active MQ Artemis(https://activemq.apache.org/artemis/index.html)
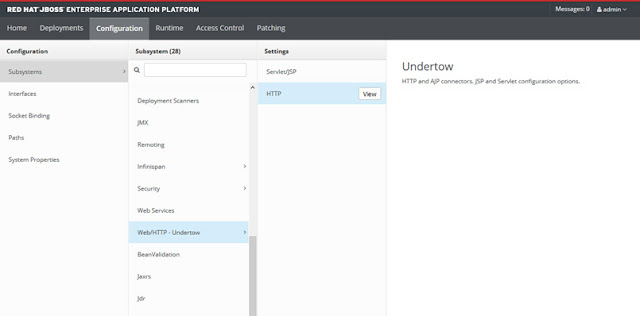
  • The replacement of JBoss Web with Undertow (http://undertow.io/)
  • Ability to use JBoss as a Load Balancer
  • Server Suspend Mode
  • Offline Management CLI
  • Profile Hierarchies
  • Datasource Capacity policies
  • Port Reduction
  • Backwards compatibility with EAP 6 and some interoperability with EAP 5

There are many more enhancements and features listed in the release notes and I am sure you will have others spring out at you as items you want to investigate more. Putting these aside for now let’s get it installed.

When I'm looking at a new system, I like to dive in and get it running, then investigate it from a first look (where I concentrate on normal operation), through to a more detailed investigation on those areas that are of interest to me.

For my first look at JBoss EAP 7, I used an Amazon EC2 t2.medium tier shared host running Red Hat Linux 7.2 (Maipo) with 4GB Ram and 2vCPUs.  I downloaded the Oracle Java JDK 8u92 (http://www.oracle.com/technetwork/java/javase/downloads/index.html ) and JBoss EAP 7.0.0 (http://developers.redhat.com/products/eap/download/) (requires Red Hat subscription) zip files and extracted them into /opt/java and /opt/jboss directories respectively. I then created users java and jboss and chown’d the respective files. I set up JAVA_HOME environment variable and I was good to go.

Fundamentally – running JBoss EAP 7 is the same as running EAP 6. You install it in the same way and run it in a similar way. The only difference for me was running on RHEL 7.2 where if you set up JBoss to run as a service you run the command without the ‘.sh’ for the script. Placing the script jboss-eap7.sh in /etc/init.d/ and then registering it through chkconfig the service is run by the command:


service jboss-eap7 start

whereas on RHEL 6 you run it as:


service jboss-eap7.sh start

The first difference I noticed when running JBoss EAP 7 for the first time is that as the libraries are based on WildFly rather than jboss-as, the logs show WFLY references rather than JBAS references. For any of us that look for the references to search for certain log entries and have monitoring set up against them this will be a big change. For example the JBoss start message is now under reference WFLYSRV0025 (whereas it used to be JBAS015874)


INFO  [org.jboss.as] (Controller Boot Thread) WFLYSRV0025: JBoss EAP 7.0.0.GA (WildFly Core 2.1.2.Final-redhat-1) started in 4142ms - Started 306 of 591 services (386 services are lazy, passive or on-demand)
INFO [org.jboss.as] (Controller Boot Thread) JBAS015874: JBoss EAP 6.4.0.GA (AS 7.5.0.Final-redhat-21) started in 3441ms - Started 192 of 229 services (68 services are lazy, passive or on-demand)

You will also notice here that even though I am running the same configuration file (standalone-full.xml) the new EAP 7 server starts a lot more services which making it start slower that EAP 6. On average (over 10 starts) EAP 7 took 4180ms, whereas EAP 6 took 3573ms

We can also compare with using the standalone.xml and you can see that also starts a lot more services for EAP 7 which means it starts slower than EAP 6. An average of 3289ms for EAP 7 and 2667ms for EAP 6.


INFO  [org.jboss.as] (Controller Boot Thread) WFLYSRV0025: JBoss EAP 7.0.0.GA (WildFly Core 2.1.2.Final-redhat-1) started in 3227ms - Started 267 of 553 services (371 services are lazy, passive or on-demand)
INFO [org.jboss.as] (Controller Boot Thread) JBAS015874: JBoss EAP 6.4.0.GA (AS 7.5.0.Final-redhat-21) started in 2652ms - Started 153 of 191 services (57 services are lazy, passive or on-demand)

The next difference I noticed was on the admin console where the layout has been changed. There are the same high level options as from the 6.4 console but when navigating into the sections the layout changes become more noticeable.


Figure 1 - JBoss EAP 7 Admin Console


Figure 2 - JBoss EAP 7 Subsystem Navigation


Figure 3 - JBoss EAP 7 Subsystem Settings

This unfortunately means more clicks to navigate to the same point you would have got to with 6.4, and as the settings encompass a whole screen you have to click back before you can navigate elsewhere. On first look this could become a frustration of using the console.

When using the CLI there are some other differences to be seen. The default port for connection to the CLI has changed from 9999 to 9990. Looking at the port configuration you can see a limited range of ports configured in EAP 7. This is because the http and management ports are used for a variety of protocols.


You can see there are no management-native or messaging ports.
It is also worth noting that the default management-https port is now 9993 rather than 9443 as it was before.

There are also some new CLI commands that can be used, such as set and unset to assign variables, unalias so you can turn off a defined alias and connection-info to show details of the connection.

There are also some new CLI operations that can be used such as list-add, list-get, list-clear, list-remove, map-get, map-clear, map-put, map-remove and query which can add and set attributes to an entity. These aren’t very well documented and will need further investigation.

There is also suspend and resume which suspends the server enabling it to complete its tasks gracefully without accepting new requests at which point you can resume it again.

Future blog posts will delve into the technology changes, features and enhancements, but from an initial first look at JBoss EAP 7 and before we do any deep investigation there are some immediate differences that will need to be thought of and evaluated when converting production systems from EAP 6.

References


JBoss EAP 7 download (requires Red Hat subscription)
http://developers.redhat.com/products/eap/download/


Red Hat EAP 7 – supported configurations (requires Red Hat subscription)
https://access.redhat.com/articles/2026253


How to Configure PHP to use the Oracle Wallet

$
0
0
by Claudio Salinitro


In today's post, I'll be looking at a problem one of our clients encountered when trying to prevent the PHP application developers from gaining access to their Oracle database passwords. Whilst the obvious answer might be to move the connection parameters to an environment-specific file, the best solution I found for our client was to configure PHP to use the Oracle Wallet. Here, I'll go through the configuration process I undertook step-by-step.


The problem

As I suggested in my introduction, the first obvious solution to the problem might be to move the connection parameters to an environment-specific file, but this will have 2 consequences: 

1.It will demand a change to their deployment procedure

2.The password would be stored in clear text on the filesystem

The solution I wanted would have to overcome these issues, and what I chose to do was configure PHP to use the Oracle wallet.


What is Oracle Wallet?

Well, from the Oracle documentation...

Oracle Wallet provides a simple and easy method to manage database credentials across multiple domains. It allows you to update database credentials by updating the Wallet instead of having to change individual datasource definitions. This is accomplished by using a database connection string in the datasource definition that is resolved by an entry in the wallet.

Exactly what we need!


Software needed

  • Apache configured with mod_php or php-fpm (compiled with oci8)
  • Oracle instant client (basic + sdk)
  • Oracle database 10g Release 2+


Create the Oracle Wallet

Create a wallet with the following command:


mkstore -wrl "wallet_path" -create
Enter password:

Enter password again:

This will create an empty password protected container (the wallet) to store your database credentials. The wallet is composed of two files, cwallet.sso and ewallet.p12, and these will be created in the [wallet path] location.

Let’s start adding some credentials to the newly created wallet, execute:


mkstore -wrl "wallet_path" -createCredential connection_string username password

Where:

  • wallet_path is the path to the directory containing the wallet
  • connection_string is a text string that will be used by our application to connect to the database with the related credentials
  • username and password are the database credentials that will be used for the connection

You can add all the credentials you want in the same wallet, as soon as they have different connection string, and you can list the credentials stored in the wallet with the following command:


mkstore -wrl "wallet_path" -listCredential


Oracle instantclient

On the machine running php, we need an Oracle client to connect to the database. Usually on the web server there is no need to install the full Oracle client, and for this reason I prefer to stay light and use the Oracle instantclient. It's a lightweight version, with no installation needed - and  is more than enough for our needs.

Download the following Oracle instantclient files from the Oracle website:

  • Instant Client Package - Basic: All files required to run OCI, OCCI, and JDBC-OCI applications

  • Instant Client Package - SDK: Additional header files and an example makefile for developing Oracle applications with Instant Client

Then unzip both packages so that you have the sdk folder inside the basic instant client folder:


/opt/oracle/instantclient_12_1
/opt/oracle/instantclient_12_1/sdk

Create the following symbolic links:


cd /opt/oracle/instantclient_12_1
ln -s libclntsh.so.12.1 libclntsh.so
ln -s libocci.so.12.1 libocci.so


Set the environment variable LD_LIBRARY_PATH:


export LD_LIBRARY_PATH=/opt/oracle/instantclient_12_1:$LD_LIBRARY_PATH

Compile PHP with the option:
--with-oci8=instantclient,/opt/oracle/instantclient_12_1

Apache/PHP configuration


Transfer the wallet on the Apache web server machine, and create a file named tnsnames.ora inside the wallet directory with the following content:


connection_string =  
(DESCRIPTION =
(ADDRESS = (PROTOCOL = TCP)(HOST = database_host)(PORT = database_port))
(CONNECT_DATA = (SID = database_sid))
)

Where:

  • connection_string = the connection string related to the credentials stored in the wallet
  • database_host = the database hostname
  • database_port = the database listen port
  • database_sid = the sid of the database
An entry for each credential that is configured in the wallet and wants to be used by the application should be created.
Create a file named sqlnet.ora inside the wallet directory with the following content:


WALLET_LOCATION =    
(SOURCE =
(METHOD = FILE)
(METHOD_DATA =
(DIRECTORY = [wallet path])
)
)

SQLNET.WALLET_OVERRIDE = TRUE

Note: The user running Apache needs to have read permission on the wallet files.


Configuration for mod_php:

Add the following environment variables to the apache startup:


export ORACLE_HOME=/opt/instantclient   
export LD_LIBRARY_PATH=/opt/instantclient
export TNS_ADMIN=/opt/wallet

I usually add these variables at the beginning of the apachectl startup script, but any other way is fine.

Stop Apache, and start it again. The apachectl restart option doesn’t work in this case because the master process will not be restarted, and will not see the new variables.

Configuration for php-fpm


If you are using php-fpm, you have to add the following settings in your pool configuration section:


env[ORACLE_HOME] = /apps/instantclient
env[LD_LIBRARY_PATH] = /apps/instantclient
env[TNS_ADMIN] = /apps/httpd/conf/wallet


Restart php-fpm processes.

Check if everything works

Create a PHP file in the DocumentRoot of your web server to test the connection:


<?php
$conn = oci_connect("/", "", "[connection string]", null, OCI_CRED_EXT);

$statement = oci_parse($conn, 'select 1 from dual');
oci_execute($statement);
$row = oci_fetch_array($statement, OCI_ASSOC+OCI_RETURN_NULLS);

print_r($row);
?>

And from the browser, call that page. Everything is working if the output is something like this:


Array ( [1] => 1 )

Security considerations

Keep in mind that the wallet security relies on the OS file permissions. Any users who have access to the wallet files will have access to the database data.

Also keep in mind that with mod_php you can have one wallet per Apache installation. This means that, in a shared environment, any applications running under the same Apache can potentially access to the data of other applications once it discovers the connection string.

With php-fpm you can have a different wallet and different configuration for each fpm pool.


Next Time...

Hopefully, the solution I found for this client will work for you, and in my next post, I'm going to continue on the same theme, but this time look at using the Oracle Wallet with Tomcat.


How to Configure Oracle Wallet with Tomcat

$
0
0
by Claudio Salinitro

In my last post, I explained how I used Oracle Wallet with PHP as a way of offering my client a way of preventing the PHP developers gaining password access to the Oracle database. In this, a follow-on post, I'll be showing you how to configure Oracle Wallet with Tomcat.


Note: The wallet is created in exactly the same way as I showed in the first post. If you refer back to those instructions, we can then move quickly on to the software you'll need:

  • Tomcat
  • Oracle database 10g Release 2+
  • Oracle jar files:
    • oraclepki.jar
    • osdt_core.jar
    • osdt_cert.jar
    • ojdbc6.jar if you are using jdk6
    • ojdbc7.jar if you are using jkd7 or jdk8
Except for the ojdbcX.jar file, it seems you can find the other jars only inside the Oracle full client directories (not in Oracle instantclient) or in the Oracle database server directories.


Oracle Wallet configuration

Transfer the wallet on the Tomcat machine and create a file named tnsnames.ora inside the wallet directory with the following content:


connection_string =  
(DESCRIPTION =
(ADDRESS = (PROTOCOL = TCP)(HOST = database_host)(PORT = database_port))
(CONNECT_DATA = (SID = database_sid))
)

Where...
  • connection_string = the connection string related to the credentials stored in the wallet
  • database_host = the database hostname
  • database_port = the database listen port
  • database_sid = the sid of the database

An entry for each credential that is configured in the wallet and wants to be used by the application should be created.

Create a file named sqlnet.ora inside the wallet directory with the following content:


WALLET_LOCATION =    
(SOURCE =
(METHOD = FILE)
(METHOD_DATA =
(DIRECTORY = [wallet path])
)
)

SQLNET.WALLET_OVERRIDE = TRUE

Note. The user running Tomcat needs to have read permission on the wallet files.

Tomcat configuration

Add the jar files (ojdbc drivers + oraclepki + osdt_core and osdt_cert) in the $CATALINA_BASE/lib directory.

Set the JAVA option -Doracle.net.tns_admin=wallet_path


export CATALINA_OPTS=-Doracle.net.tns_admin=/apps/tomcat/conf/wallet

Finally restart Tomcat.

Test JSP page

If everything is OK, the configuration should already be working - but we need a test web application to to confirm it.

For testing purposes, we can use the ROOT web application that is already in place, and which is shipped with any Tomcat distribution. Create a walletTest.jsp file in your $CATALINA_BASE/webapps/ROOT folder, with the following content:


<%@page import="java.sql.*, javax.sql.*, javax.naming.*, java.io.*"%>

<html>
<head>
<title>DB Test</title>
</head>
<body>

<%
Context context =new InitialContext();
Context envCtx =(Context) context.lookup("java:comp/env");
DataSource ds =(DataSource)envCtx.lookup("jdbc/myoracle");
PrintWriter res = response.getWriter();
Connection conn = ds.getConnection();
Statement stmt = conn.createStatement();
ResultSet result = stmt.executeQuery("SELECT 1 FROM DUAL");
while(result.next()){
String code = result.getString(1);
res.print(code);
}
%>

</body>
</html>

And add the following configuration to the $CATALINA_BASE/conf/context.xml file, between the <context></context> tags:


<Resource name="jndi_name" auth="Container" type="javax.sql.DataSource" driverClassName="oracle.jdbc.OracleDriver" url="jdbc:oracle:thin:/@connection_string" connectionProperties="oracle.net.wallet_location=wallet_path"/>

Where...


  • wallet_path is the path to the directory containing the wallet - in my case    /apps/tomcat/conf/wallet
  • connection_string is a text string that will be used by our application to connect to the database with the related credentials - in my case db_credentials1
  • jndi_name is the jndi name used by the applications to use the datasource - in my case jdbc/myoracle

Security considerations

As it was for Apache, also for Tomcat or any other application server, the wallet security relies on the OS file permissions. Any users who have access to the wallet files will have access to the database data.

Also keep in mind that you cannot configure more than one wallet on the same Tomcat instance. This means that any applications running on the same Tomcat instance can potentially access the data of other applications once it discovers the connection string.


Planning for a JBoss EAP 7 Migration

$
0
0

by Brian Randell


In my previous post, I had a ‘First Look’ at Red Hat JBoss EAP 7 and highlighted a few fundamental changes from EAP 6. This post has been written to dive deeper under the covers, and aims to examine the key differences between the two versions, looking primarily at the impact of migrating to this version from EAP 6.

I want to consider whether there are any operational considerations regarding migration, and further expand on some of the points raised when I first opened the EAP 7 box.


Support Timeline


Full Support for JBoss EAP 6 finishes at the end of June 2016 - which means there will be no minor releases or software enhancement to the EAP 6 code base from then on. Maintenance support ends June 2019 and Extended Life Support ends in June 2022.

So, if you're happy with the features you have and the system's stability, then bug fixes will still be provided for a while to come. However, if you're looking to use newer features and take advantage of those provided by Java EE 7, for example, then it's worth starting the evaluation cycle for JBoss EAP 7 now, so that when the first point release arrives (which is historically the more stable release) you are ready to implement into production.

Differences

As is the nature of new releases, some of the older technologies are not supported or are untested - and hence unverified whether they work. For JBoss EAP 7, it is only supported for Java 1.8+ and has not been tested on RHEL 5 or Microsoft 2008 server (Note: it has been tested on Microsoft 2008 R2 server).  

Some of the notable untested database integrations include Oracle 11g R1, Microsoft SQL Server 2008 R2 SP2 and PostgreSQL 9.2 – though I would expect these to be added to over time if there is demand. One addition to the database integration testing has been for MariaDB. Fundamentally, though, the support and testing is in line with previous versions of EAP and what you would expect.

Looking at the Java EE standards supported in EAP 7, JAX-RPC is now not available with preference to use JAX-WS. The standards that have been updated are:

  • Java EE
  • Java Servlet
  • JSF (JavaServer Faces)
  • JSP (JavaServer Pages)
  • JTA (Java Transaction API)
  • EJB (Enterprise Java Beans)
  • Java EE Connector Architecture
  • JavaMail
  • JMS (Java Message Service)
  • JPA (Java Persistence)
  • Common annotations for the Java Platform
  • JAX-RS (Java API for RESTful Web Services)
  • CDI (Contexts and Dependency Injection)
  • Bean validation


The major updates here are primarily for Java EE, JMS and JAX-RS that all have major version changes.

Corresponding to the standards updates, notable component changes from EAP 6 are :

  • JBoss AS has been replaced with the Wildfly Core
  • JBoss Web has been replaced with Undertow
  • HornetQ has been replaced with Active MQ Artemis (though the HornetQ module is retained for backwards compatibility)
  • Apache Web Server has been removed
  • jBeret has been added
  • JBoss Modules has been removed
  • JBoss WS-Native has been removed
  • JSF has been removed
  • The Jacorb subsystem has been removed and switched to OpenJDK ORB
  • The JBoss OSGi framework has been removed


With the standards, components and module changes, you can see that there are a lot of areas that will need to be checked, reconfigured and tested before using EAP 7 with existing code.

Migration

There should always be care consideration given to migrating major versions of an application. In all cases, full evaluation and testing should be undertaken to reduce the risk when deploying to the new environment. 

There are a significant number of changes between EAP 6 and EAP 7 with the updated standards used - deprecated APIs, modules and components and modified configuration structure. However there are also a number of compatibilities and interoperabilities provided in EAP 7 that should make the migration easier with proper planning and testing.

Migration tasks should be thought of from various points of view. The main ones I think about when migrating are:

1. Environment
  • Do I need to modify CPU, Memory, Storage, Network, Architecture for the new solution?
  • Can I upgrade inline or side by side, all at once or some servers at a time?


2. Code
  • Are there deprecated APIs that are used that need to be updated?
  • Do current API calls behave in the same way?


3. Server Configuration
  • Are there server configuration settings that need to be changed?
  • Are the CLI commands the same or are there new ones?


4. Monitoring
  • Is the monitoring you have in place compatible with the new solution?
  • Are there new configurations to add or amend for the updated components and modules?
  • Does the logging behave in the same way?


5. Process / Procedure
  • Are your procedures for operational tasks the same or do they need amending?
  • Are your operational scripts still fit for purpose?


6. Testing
  • Functional, Integration and Performance testing is required to ensure the application behaves within agreed thresholds.

Code

From a code perspective, as mentioned, there are a number of deprecated features and updated standards, so the code will need to be checked and verified to understand whether any code will need changing to ensure compatibility with the new and updated modules.

For this there is a tool called Windup which is part of the Red Hat JBoss Migration Toolkit that provides an analysis of your code and what will need to be changed.

Some areas that the developers need to be aware of that haven’t already been mentioned are:

  • RESTEasy has a number of deprecated classes
  • Hibernate Search changes
  • JBoss logging annotations change

There are a lot of areas to check in the code, so as a first pass it is sensible to use the Windup tool.

Server Configuration

For the server configuration there are several approaches:

The recommended approach is to use the JBoss server migration tool - but this is currently in alpha (and hence unsupported) and only currently works against EAP 6.4 standalone servers. This is currently being developed though, and I expect it to be expanded to work across more versions and be a full release.

An alternative is to use the EAP 6 configuration as the configuration for EAP 7 and use the inbuilt CLI commands for migrating the subsystems of messaging, web and jacorb over to the new subsystems. This though does not update all the required server configuration so you are caught with still potentially having to make changes in order to achieve a finalised configuration.

I personally will always keep CLI scripts to configure the server so if a new server is required I can easily run these scripts and the server will be configured. These can be run on a newly installed version of EAP 7 and amended as required to use the new subsystems and configuration structure.

None of the ways described are clean and simple solutions, so there will need to be close attention paid to ensuring the configuration is correct.

Some of the areas that you need to be aware of are:

  • The ‘web’ subsystem is now the ‘undertow’ subsystem
  • Valves are not supported and need to be migrated to Undertow handlers
  • Rewrite sub-filters need to be converted to expression-filters
  • The ‘messaging’ subsystem is now the ‘messaging-activemq’ subsystem and rather having a ‘hornetq-server’ it is now simply ‘server’
  • To allow EAP6 JMS connections ‘add-legacy-entries’ needs to set to true when migrating via CLI
  • The threads subsystem has been removed and now each subsystem uses its own thread management

It should be noted that the list of other changes that will affect the server configuration is large and too numerous to be listed here. This highlights how much care will need to be taken to get the server configuration right. When the JBoss Server Migration Tool is fully available then this will be a good option.


Architecture

There are also architecture concerns you need to be aware of when planning your migration. Some notable ones are :

  • Clusters must be the same version of EAP (So you will need to upgrade an entire cluster at a time)
  • JGroups now use a private interface (as opposed to public) as best practice means they should use a separate network interface.
  • Infinispan now uses distributed ASYNC caches for its default clustered caches rather than replicated
  • Messaging directory and file structure has changed. They are now named with reference to ActiveMQ rather than HornetQ.
  • Log messages are newly prefixed with the WFLY project codes

There are significant enough differences here to revisit the architecture design of your environment and verify it still fits for EAP 7.

Summary

There are a significant number of changes between JBoss EAP 6 and JBoss EAP 7, with a number of modules and components being updated to cater for the updated standards - resulting in API deprecation and configuration changes. 

This means the migration path may not be simple, the architecture may need to be reconsidered and the operational procedures may need to be modified. This can be eased by the use of Windup for code analysis, and the JBoss Migration Toolkit.

However there is still a lot to verify, reconfigure and test both from a code perspective and a server configuration/architecture perspective.


Resources


EAP 7 Supported Configurations -> https://access.redhat.com/articles/2026253
EAP 7 Included modules (requires a RedHat subscription account) -> https://access.redhat.com/articles/2158031

Monitoring Tomcat with JavaMelody

$
0
0
In this post, troubleshooting specialist, Andy Overton describes an on-premise monitoring solution he deployed for a customer using a small number of Tomcat instances for a business transformation project. Using a step-by-step approach, he walks through his JavaMelody configuration and how he implements alerts in tandem with Jenkins.


Introduction

Whilst working with a customer recently I was looking for a simple, lightweight monitoring solution for monitoring a couple of Tomcat instances when I came across JavaMelody.

https://github.com/javamelody/javamelody/wiki

After initial setup - which is as simple as adding a couple of jar files to your application - you immediately get a whole host of information readily available with no configuration whatsoever.

Playing about with it for a while and being impressed, I decided to write this blog because I thought I might be able to use my experiences to throw some light on a few of the more complex configurations (e-mail notifications, alerts etc.).

Technology Landscape

I’m going to start from scratch so you can follow along. To begin with, all of this was done on a VM with the following software versions:
  • OS – Ubuntu 16.04
  • Tomcat – 8.0.35
  • JDK - 1.8.0_77
  • JavaMelody – 1.59.0
  • Jenkins - 1.651.2

Tomcat Setup

Download from http://tomcat.apache.org/download-80.cgi

Add an admin user:
Add the following line to tomcat-users.xml:


<rolerolename="manager-gui"/>
<userusername="admin"password="admin"roles="manager-gui"/>


Start Tomcat by running <TOMCAT_DIR>/bin/startup.sh

The management interface should now be available at: http://localhost:8080/manager


JavaMelody Setup

Download from https://github.com/javamelody/javamelody/releases and unzip.

Add the files javamelody.jar and jrobin-x.jar to to the WEB-INF/lib directory of the war file you want to monitor.

I used a simple testapp used for testing clustering. Obviously we’re not testing clustering here but it doesn’t actually matter what the application does for our purposes.

Download the clusterjsp.war from here (or use your own application):
http://blogs.nologin.es/rickyepoderi/uploads/SimplebutFullGlassfishHAUsingDebian/clusterjsp.war

Drop the war file in the <TOMCAT_DIR>/webapps directory and it should auto-deploy.

Point a browser to http://localhost:8080/clusterjsp/monitoring and you should see a screen similar to this screen grab from github:


First Look

For new users, I'll just offer a quick run-down of my out-of-the-box experience. First thing you see are the graphs you have immediately available:

  • Used memory
  • CPU
  • HTTP Sessions
  • Active Threads
  • Active JDBC connections
  • Used JDBC connections
  • HTTP hits per minute
  • HTTP mean times (ms)
  • % of HTTP errors
  • SQL hits per minute
  • SQL mean times (ms)
  • % of SQL errors
You can access additional graphs for such things as garbage collection, threads, memory transfers and disk space via the 'Other Charts' link, and helpfully these can be easily expanded with a mouse click. Less helpfully, there's no auto-refresh so you do need to update the charts manually.


If you scroll down, you'll find that 'System Data' will make additional data available and here you can perform the following tasks:
  • Execute the garbage collector
  • Generate a heap dump
  • View a memory histogram
  • Invalidate http sessions
  • View http sessions
  • View the application deployment descriptor
  • View MBean data
  • View OS processes
  • View the JNDI tree

You can also view the debugging logs from this page - offering useful information on how JavaMelody is operating.


Reporting Configuration Guide

JavaMelody features a reporting mechanism that will produce a PDF report of the monitored application which can be generated on an ad-hoc basis or be scheduled for daily, weekly or monthly delivery.

To add this capability simply copy the file itext-2.1.7.jar, located in the directory src/test/test-webapp/WEB-INF/lib/ of the supplied javamelody.zip file to <TOMCAT_DIR>/lib and restart Tomcat.

This will add 'PDF' as a new option at the top of the monitoring screen.

Setting up an SMTP Server
In order to set up a schedule for those reports to be generated and sent via email, you first need to set up a Send Only SMTP server.

Install the software: sudo apt-get install mailutils

This will bring up a basic installation GUI and here you can select 'Internet Site' as the mail server configuration type. Then simply set the system mail name to the hostname of the server.

You'll then need to edit the configuration file /etc/postfix/main.cf and alter the following line from inet_interfaces = all to inet_interfaces = localhost

Restart postfix withsudo service postfix restart

You can test it with the following command (replacing the e-mail address):
echo "This is a test email" | mail -s "TEST" your_email_address


Scheduling the Report
With the email done, the next step is to schedule JavaMelody to send out daily e-mails of the PDF report. Firstly we need to download a couple of additional libraries.


When you have these, copy both files to <TOMCAT_DIR>/lib and add the following code to <TOMCAT_DIR>/conf/context.xml (replacing the e-mail address):


<Resourcename="mail/MySession"auth="Container"type="javax.mail.Session"
mail.smtp.host="localhost"
mail.from="no-reply@test.com"
/>
<Parametername="javamelody.admin-emails"value="your_email_address"override="false"/>
<Parametername="javamelody.mail-session"value="mail/MySession"override="false"/>
<Parametername="javamelody.mail-periods"value="day"override="false"/>


Once the server is started, you can send a test mail by calling this action:

http://<host>/<context>/monitoring?action=mail_test

Alerts (Using Jenkins)

Alerting takes a little more setting up and isn’t provided by JavaMelody itself. Instead, it's provided by Jenkins with a Monitoring add-on, so first of all, you'll need to download Jenkins from:


Use the following command to run Jenkins (we need to run on a different port as we have Tomcat running on the default 8080):  java -jar jenkins.war --httpPort=9090

Jenkins is now available at: http://localhost:9090

The nest step is to install the following plug-ins for Jenkins:
  • Monitoring – Needed for linking in with JavaMelody
  • Groovy – Needed to run Groovy code. This is required for setting up the alerts.
  • Email Extension – Needed to customise the e-mails Jenkins sends out

To install the monitoring plugin:
  1. Click 'Manage Jenkins'
  2. Select 'Manage Plugins'
  3. Select 'Available'
  4. Find and select the 'Monitoring Plugin'
  5. Click 'Install without restart'

Then follow the same procedure for Groovy and Email Extension. 


Groovy Configuration

Now, let's make sure the Groovy runtime is installed and configured by using sudo apt-get install groovy to install it to /usr/share/groovy

In order to run our Groovy scripts and call JavaMelody methods we'll need log4j and JavaMelody on the Groovy classpath. JavaMelody uses an old version for log4j (1.2.9) which can be downloaded from:


To configure Groovy:
  1. Go to Manage Jenkins, select 'Configure System'
  2. Under the Groovy section, select 'Groovy Installations'
  3. Add a name for your installation.
  4. Set GROOVY_HOME to /usr/share/groovy


Email Extension Plugin Configuration
  1. Go to Manage Jenkins, select 'Configure System'
  2. Under Jenkins location, set the URL to: http://hostname:9090 (replacing hostname with your hostname)
  3. Set the System Admin e-mail address to: donotreply@jenkins.com (or something similar – this is the address that alert e-mails will be sent from.
  4. Under the Extended E-mail Notification section, set SMTP server to localhost

Creating Alerts
Next up we'll set up a test alert, which triggers when there are more than 0 HTTP sessions - obviously not realistic, but good for demo and testing purposes.

From the main Jenkins menu:
  1. Select 'New Item'
  2. Select 'Freestyle' project
  3. Add the following details:
  • Name - High Session Count Alert
  • Description - Test alert triggered when there are more than 0 HTTP sessions
  • Under 'Build Triggers', select 'Build' and 'Periodically'

    Now you can schedule how often to run your alert check. The syntax is exactly like a cronjob. Here we will set it to run our check every 10 minutes using the following: */10 * * * *
  • Under 'Build', click 'Add build step'
  • Select 'Execute Groovy' script
  • Set the 'Groovy Version' to whatever you called it previously
  • Add the following Groovy code:

  • importnet.bull.javamelody.*;

    url ="http://localhost:8080/clusterTest/monitoring";

    sessions =new RemoteCall(url).collectSessionInformations(null);

    if(sessions.size()>0)thrownew Exception("Oh No - More than zero sessions!!!");

    This simple piece of code calls the URL of JavaMelody, retrieves the sessions information and then if that size is greater than zero, throws an Exception. Add javamelody.jar and log4j jar to the classpath (under Advanced) e.g.:


    /home/andy/javamelody/javamelody.jar:/home/andy/logging-log4j-1.2.9/dist/lib/log4j-1.2.9.jar

    Under 'Post-Build Actions', select 'Add post build action', then select 'Email Notification', add the email address to send the alert to and finally, Save.

    Testing

    In order to test the alert triggers as required simply call your application e.g.


    You should receive an e-mail with the subject 'Build failed in Jenkins', which looks something like this:


    ------------------------------------------
    Started by user anonymous
    Building in workspace <http://192.168.43.129:9090/job/High%20Session%20Count%20Alert%202/ws/>
    [workspace] $ /usr/share/groovy/bin/groovy -cp /home/andy/javamelody/javamelody.jar:/home/andy/logging-log4j-1.2.9/dist/lib/log4j-1.2.9.jar "<http://192.168.43.129:9090/job/High%20Session%20Count%20Alert%202/ws/hudson4959397560302939243.groovy">
    Caught: java.lang.Exception: Alert-Start
    Oh No - More than zero sessions!!! Number of sessions: [SessionInformations[id=9BBFCF23C5126EDDBD44B371F1B11FD0, remoteAddr=127.0.0.1, serializedSize=229]]
    Alert-End
    java.lang.Exception: Alert-Start
    Oh No - More than zero sessions!!! Number of sessions: [SessionInformations[id=9BBFCF23C5126EDDBD44B371F1B11FD0, remoteAddr=127.0.0.1, serializedSize=229]]
    Alert-End
    at hudson4959397560302939243.run(hudson4959397560302939243.groovy:7)
    Build step 'Execute Groovy script' marked build as failure


    As Jenkins is generally used as a build tool, the outgoing e-mail isn’t the most user friendly when we’re looking to use it for alerting purposes. So, the final thing we will look at is altering the outgoing e-mail into something more legible.

    Editing the Outgoing Email


    First of all we will alter the Groovy script so that we can strip out the stack trace and additional information that we don’t need as we’re alerting on a specific condition of our app, not the underlying JavaMelody code.


    In order to do so we will use Alert-Start and Alert-End to indicate the start and end of the alert message we want to put in the e-mail we will send out. Later we will use a regular expression to extract this from the whole Exception.

    Go to the High Session Count Alert project and alter the last line of the Groovy script, changing it from:


    if(sessions.size()>0)thrownew Exception("Oh No - More than zero sessions!!!");

    to 

    if(sessions.size()>0)thrownew Exception("Alert-Start\nOh No - More than zero sessions!!! Number of sessions: "+ sessions.size()+“\nAlert-End);

    1. Click Configure
    2. Delete the e-mail notification post-build action
    3. Add a new one - Editable Email Notification
    4. Set Project Recipient List, add your e-mail address
    5. Set the Default Subject to - JavaMelody - High Session Count ALERT
    6. Set the Default Content to the following:

    Build URL : ${BUILD_URL}

    Alert : ${PROJECT_NAME}

    Description: ${JOB_DESCRIPTION}

    ${BUILD_LOG_EXCERPT, start="^.*Alert-Start.*$", end="^.*Alert-End.*$"}

    This will result in an e-mail containing the following:

    Build URL : http://192.168.43.129:9090/job/High%20Session%20Count%20Alert/252/

    Alert : High Session Count Alert

    Description: Test alert triggered when there are more than 0 HTTP sessions

    Oh No - More than zero sessions!!! Number of sessions: 1

    The key thing here is the BUILD_EXCERPT. This takes in 2 regular expressions to indicate the start and end lines within the build log. This is where we strip out all of the extraneous stack trace info and just get the message between the Alert-Start and Alert-End tags.


    To see a list of all available email tokens and what they display, you can click the "?" (question mark) next to the Default Content section.

    Conclusion

    Hopefully, this blog has given you a good starting point for using JavaMelody and Jenkins to monitor your Tomcat instances. There is a lot more that I haven’t covered but I’ll leave that as an exercise for the reader to dig a little deeper.

    I’ve been impressed by it as a simple to set up, free monitoring tool. Configuring the alerts is a bit more of an effort but it’s nothing too difficult and it’s a tool I’d certainly recommend.

    Planning a Successful Cloud Migration

    $
    0
    0
    For most organisations, migrating some or all of your applications to a cloud hosting provider can deliver significant benefits, but like any project it is not without risks and needs to be properly planned to succeed.  In this post, c2b2 Head of Profession, Matt Brasier offers an overview of a talk he recently gave to delegates attending the Oracle User Group (OUG) Scotland. He'll look at some of the things that you can do at a high level to help you get the most of your cloud migration - and break down some of the common factors into more concrete considerations.


    Understand what you are looking to get out of the migration

    As with anything your business does, there needs to be a good reason to do it, and in the case of a cloud migration, the reasons usually come down to costs. 

    However there are other benefits that can be realised during a cloud migration programme that (while they come down to reducing costs in the end) produce more immediate and tangible benefits. Moving some of your organisation's infrastructure to the cloud is going to necessitate some changes in job roles and responsibilities, together with bringing in new ways of working and processes. A cloud migration programme is a great time to bring more modern development and operations (or DevOps) processes in, providing benefits in terms of delivering quicker application fixes and improvements to the end users.

    Cloud infrastructure often provides less scope for customisation compared to running the same applications on-premise, and while that can cause some problems, it does force your organisation to limit itself to using common or standards based approaches, rather than developing their own. 

    Eliminating customised or bespoke infrastructure and applications where possible reduces your support costs, as it allows you to find commodity skills in the market to maintain them, rather than having to train people in-house.

    In order to make sure that your migration is actually successful (i.e. delivers what you are looking for rather than just moving you to cloud because someone told you it was a good idea), you need to properly identify where you are expecting to make savings (hardware, infrastructure management staff, licenses and support costs) and what your new costs will be (how much capacity will you need, what retraining is needed, what processes and procedures need to change).

    Cloud vendors will often over-hype the cost savings you can make by not including the costs of things like upskilling and retraining in their analysis. If the main objective of a migration to the cloud is cost saving then you need to ensure you fully understand all the costs of the migration.


    Plan the migration and manage risks

    Once you understand why you want to migrate, and what success looks like, you need to plan how you get there. The risks to a migration project can broadly be categorised into two types:

    • Technical risks
      Where applications or components don’t work in the cloud, or need wore work than anticipated to get working
    • Non-technical risks
      Where business or process factors need to change


    A migration from on-premise infrastructure (or infrastructure rented in a data centre) to a cloud provider is different to just upgrading your infrastructure versions and refreshing the hardware. 

    It is key to consider from the start that you will be significantly changing the way some people need to perform their jobs, and will possibly even making people redundant. The project therefore needs to be handled with sensitivity and care from the start, ensuring that retraining and organisational change are tackled at the same time as technical migration.

    At a more technical level, it is important to understand how many systems you are planning on moving to the cloud and when they will move. There will be dependencies between systems that will need to be managed, and interfaces between your cloud infrastructure and on-premise infrastructure that need to be migrated.

    One of the biggest factors to consider when planning your migration is whether you plan to “cut over” to the cloud systems as a big bang, where all systems are migrated at once, or in a staged process. There are advantages and disadvantages to both approaches, so its worth considering in detail for your particular organisation. It is also possible (in fact likely) that there are some applications in your organisation which will be very costly (or possibly technically impossible) to migrate, so you need to plan for what you do with these – for example you may need to rewrite them in different technologies, or just age them off.

    A cloud migration is not just a technical task, and there will be a number of business processes and strategies that will need to be reconsidered or rewritten from scratch. DR and business continuity plans, support processes, new account processes, etc, may all need to be rewritten with new ways of doing things.


    Avoid common pitfalls

    There are a number of common pitfalls that people come across, that can result in a cloud migration project not delivering its benefits, or not giving the anticipated savings. 

    The main cause of this is underestimating in some way the complexity of the task, or trying to rush it and making early mistakes. It is not uncommon to find undocumented interfaces in a system that is to be migrated (for example, reliance on shared file systems or authentication providers) that are not covered on infrastructure diagrams, and so get forgotten in migration planning.

    Another key cause of failure is not planning for the business and process change needed with adopting a cloud provider, leaving staff forced to accept changes that they don’t understand, and without the necessary skills to perform their jobs.


    All of the above pitfalls can be avoided with good planning and an understanding of the complexities of a cloud migration project, allowing you to deliver the very real benefits and cost savings that a cloud infrastructure can provide. 

    If you're considering the cloud as part of your infrastructure strategy and would like to discuss your project with Matt, contact us on 0845 539457 to arrange a conference call.


    Looking for Reliable WildFly Support for your Business or Organisation? Six Things You Need to Think About!

    $
    0
    0
    If you’re using WildFly as part of a commercial middleware infrastructure, then you’ll understand the importance of having access to high quality middleware support – and the need for expert WildFly troubleshooting advice when faced with business-critical tickets.


    Expert WildFly Support from the UK's Leading Middleware experts


    Whilst the WildFly community offers a huge source of knowledge, expertise and enthusiasm for upstream JBoss middleware (we should know, because we’re part of it) finding the specific information you need at the time you need it most - and being able to apply it to your operational environment with best practice expertise within a priority one time frame can challenge even the best in-house middleware teams.

    In this post, we’ve summarised our experiences of the WildFly world (and those of clients) into six key things to think about if you’re accountable for your organisation’s WildFly support. Hopefully it will shed some light on some of the pitfalls that might lie ahead – and help you make better decisions when planning your middleware support strategy.


    JBoss WildFly Troubleshooting and support
    The most common touch-points we have with new clients is when something breaks and they reach out to us for WildFly troubleshooting engagements.  Often they’re searching for solutions to poor deployments implemented by alternative service providers, but frequently they find that whilst their in-house team delivered a decent implementation project, they have since run into problems.

    Regardless of the middleware technology deployed, there’s a huge difference between the skill sets required to implement the product, and those needed to manage and maintain operational performance. WildFly is no different - and because you can’t fall back on a Red Hat support license, the need for a sound support strategy becomes even more critical.

    Without hands-on experience of how the technology works for real-world business operations, we often find that the in-house team members who have championed the initial WildFly implementation project don’t always have the understanding or investigatory skills needed to fully support operational performance.

    What to think about…
    The situation described above isn’t a great one to find yourself - so if you’re using WildFly, make sure you get your operational performance objectives clear and carry out an honest appraisal of your team’s ability to investigate problems across the infrastructure and support those issues.

    If you’re embarking on a WildFly implementation, do the same – but look beyond the potentially low cost entry and focus on the potential costs of meeting those objectives - and the cost to the business of operational failure. Think about the investment you’ll need to make in recruitment, training and resource management to achieve the level of cover and the expertise you’ll need to resolve a whole spectrum of service failure scenarios.


    Even the less complex middleware environments use a range of dependent technologies which can be implicitly related to WildFly performance – for example, load balancers like Apache, Nginx or HAProxy), databases, ESB, or message brokers likeActiveMQ or other JMS providers.

    Whether there is a particular tech under the WildFly hood or whether WildFly is working in tandem with other Java technologies, an expertise across the whole landscape of your systems is essential in order to investigate and identify the root-causes of your WildFly tickets.

    Even the most ardent in-house WildFly enthusiasts may not have the experience of working across all the technologies you’re using – or understand the interdependencies that can affect operational performance. It can be pretty straight forward getting an app running, but much harder getting it to perWeform well.

    It can take years of supporting complex middleware infrastructure to analyse issues with speed and accuracy; and an awareness of the whole landscape to deliver an appropriate solution.

    What to think about…
    What are your team’s real core skills and can you rely on them to deliver bullet-proof operational fixes when you need them most and against the clock?

    If you’re thinking about support – think about proven WildFly problem-solving skills in a pressurised commercial environment.

    Even if it were possible to stick a plug into the back of your head and download the WildFly community knowledge base, your team still need the skills to research and resolve complex investigations.

    It’s true, the WildFly community is a hub of expertise and knowledge - but for all the thousands of blog posts, forums, technical documents, videos, webinars, opinion pieces, case studies and walk-throughs that you could find if you looked hard enough, how many will be relevant to the specific support issues your team will face on a daily basis?

    Bear in mind that not one member of that global community has any knowledge of you, your business or your operational needs; they haven’t examined your architecture, they don’t know your configurations, they have no idea how WildFly fits within your infrastructure or how it meets your business needs. Nor do they have any concept of the risks you face or the resolution times you have to meet.

    On top of this, the process of searching through the vast expanse of information out there is a daunting prospect. Knowing which sources to trust, identifying relevant content, and piecing together your solutions not only requires excellent search and discover skills, but can devour your response times. 

    What to think about…
    If you think in these terms, using the WildFly community as a business-critical resource is something that probably shouldn’t feature too strongly in your support strategy! 

    As an up-stream open source solution, it can also be more difficult to transition from one version of WildFly to the next – and this difficulty isn’t limited to WildFly itself when there are other dependencies within the infrastructure.

    So, consider whether your team have the capabilities to implement ongoing release cycles, updates and patching across your middleware – and will they understand broader implications?


    If your business services are operating around the clock, at some point you’ll face the challenge of rectifying systems or reinstating service availability out of office hours when your team isn’t available and you might not be able to attend to the problem remotely. 

    Unless you invest in an in-house team structure that guarantees on-call expert WildFly support around the clock regardless of leave and illness, you’ll continually run the risk of extended business downtime – and since WildFly is an unsupported Red Hat product, the challenge of rectifying services in that scenario can become a solitary one!

    What to think about…
    When planning for support, think about how a team rota would look if you’re covering your business operations. Accommodating for leave, maternity/paternity, illness and recruitment issue can start to look expensive – and remember that not only will you need to find those skills in the market-place, but you’ll need to manage them as well! 


    The conversations we have with companies and organisations when discussing support services often feature tales of frustration and dissatisfaction with experiences of help-desks employing off-shore support engineers.

    Whilst working with large sub-contracting organisation may offer a relatively lower-cost option on paper, you only realise the true value of support when you really need it most. When your business is down and the accountability for rectification is on your shoulders, the last thing you want to deal with is a support engineer with limited or no knowledge of your company, a lack of understanding about your infrastructure, and no experience of your operational priorities.

    Instead of answering questions to fill the knowledge gaps about who you are and what middleware you’re using – you should be answering questions directly posed to investigate and resolve the issue in hand.

    What to think about…
    When you enter into an out-sourced WildFly support contract, make sure you have a clear understanding of the relationship you’ll have with the service provider. A larger provider may not give you the level of personal service you enjoy with a niche company, and are less likely to be as engaged with your objectives. 

    You might feel more reassured by a provider who offers up-front health checks and infrastructure evaluation prior to support commencing, or one who demonstrates an ethos of partnership in the provision of support. Ultimately you want to know that you’re working with people who not only support your middleware, but your business objectives as well.


    If you do find a company capable of supporting your WildFly environments to the standards you expect, it can be frustrating to then find they don’t have the skills or resources to offer additional middleware service solutions.

    Working with a provider who can deliver a completely integrated portfolio of WildFly services is a more reassuring and easier proposition. What clients we speak with find of enormous value is having a dedicated account manager who not only handles support services, but who can also deliver project proposals from proof-of-concept and architectural design to implementation and DevOps.

    What to think about…
    Take another step forward and think of how good it would be to have the account manager, the support engineers and the professional services consultants fully integrated into the same team. 

    This holistic ethos would create a genuine shared knowledge about your organisation, an understanding of your infrastructure and a team of experts available to call upon via support tickets or full-service projects. 


    When we spoke with our clients and asked them about their decision-making processes for WildFly support – these six items were always the ones we had the most conversations about. Of course, it’s not an exhaustive list, but hopefully demonstrates a few of the issues you might want to think about when putting together a support strategy.

    Finally, the issues raised here concern supporting business operations, but there may come a time when the organisation wants to consider new paradigms such as transitioning to microservices architecture – or even moving to JBoss enterprise infrastructure. Whilst this goes beyond the scope of a support service, think of the advantages of having an independent professional middleware consultancy with expertise in swarm, service discovery, containers, DevOps and enterprise application platforms.


    If you are considering WildFly support or want to discuss broader WildFly projects, contact us using the form below and we’ll put you in touch with one of our Red Hat specialists.


    How to Configure JBoss EAP 7 as a Load Balancer

    $
    0
    0
    Following on from Brian's recent work on Planning for a JBoss EAP 7 migration, he returns to the new features now available to JBoss administrators, and looks specifically at configuring Undertow as an http load balancer.


    Environment

    The environment I used was an Amazon EC2 t2.medium tier shared host running Red Hat Linux 7.2 (Maipo) with 4GB Ram and 2vCPUs.  This has Oracle Java JDK 8u92 and JBoss EAP 7.0.0 installed.

    I wanted to have three separate standalone servers, so I copied the standalone folder three times from the vanilla EAP 7 install and renamed them standalone-lb, standalone-server1, standalone-server2.

    I then ran three instances of JBoss using the -Djboss.server.base.dir command line argument for each one, to specify the three different configurations. I kept the lb server with the default ports but used the port offset argument -Djboss.socket.binding.port-offset to offset the ports by 100 for each server.

    Hence, for http the lb was running on port 8080 and server1 and server2 were running on ports 8180 and 8280 respectively.

    Application

    Next I needed to find a web application to run on JBoss that would show me that the load balancing had pointed to that server.

    I decided to use the JBoss EAP 7 Quickstart for helloworld-html5. This provides a very simple page to display where you can add your name, press a button and it will display it.  What it also does is provide a stdout message in the logs with the name you have entered.  Hence it is easy to know which server you have connected to.

    I imported the helloworld-html5 project into JBoss Developer Studio and exported the war file which I then deployed onto server1 and server2.
    Testing it on server 2 (with port offset of 200) using the URL http://<hostname>:8280/helloworld-html5/ you can see the message displayed on the screen and the name entered in the log file:


    Configuring

    So now we need to configure the load balancing on the lb server.
    For this we need to add some configuration to Undertow to reference the outbound destinations we also need to configure for our servers.
    We will be :


    • Adding in remote outbound destinations for the servers we want to load balance (providing the hostname and port)
    • Adding a reverse proxy handler into Undertow
    • Adding the outbound destinations to the reverse proxy handler (setting up the scheme we want to use, i.e. ajp or http, and the path for the application which in our case is helloworld-html5)
    • Adding the Reverse Proxy location (i.e. what url path will we follow on the Load Balancer for it to be redirected)


    The following CLI configured the outbound destinations:


    /socket-binding-group==standard-sockets/remote-destination-outbound-socket-binding=lbhost1/:add(host=10.0.0.55, port=8180)
    /socket-binding-group==standard-sockets/remote-destination-outbound-socket-binding=lbhost2/:add(host=10.0.0.55, port=8280)


    You can see these now configured in the console :


    The following CLI added the reverse proxy handler (I have called it ‘lb-handler’) to Undertow:


    /subsystem=undertow/configuration=handler/reverse-proxy=lb-handler:add

    The following CLI adds the remote destinations to the reverse proxy handler (I have named the hosts ‘lb1’ and ‘lb2’ and have named the instance-id ‘lbroute’ for both so it will round robin around them):


    /subsystem=undertow/configuration=handler/reverse-proxy=lb-handler/host=lb1:add(outbound-socket-binding=lbhost1, scheme=http, instance-id=lbroute, path=/helloworld-html5)
    /subsystem=undertow/configuration=handler/reverse-proxy=lb-handler/host=lb2:add(outbound-socket-binding=lbhost2, scheme=http, instance-id=lbroute, path=/helloworld-html5)

    We can now see the completed handler configuration :


    /subsystem=undertow/configuration=handler/reverse-proxy=lb-handler:read-resource(recursive=true)
    {
    "outcome" => "success",
    "result" => {
    "cached-connections-per-thread" => 5,
    "connection-idle-timeout" => 60L,
    "connections-per-thread" => 10,
    "max-request-time" => -1,
    "problem-server-retry" => 30,
    "request-queue-size" => 10,
    "session-cookie-names" => "JSESSIONID",
    "host" => {
    "lb1" => {
    "instance-id" => "lbroute",
    "outbound-socket-binding" => "lbhost1",
    "path" => "/helloworld-html5",
    "scheme" => "http",
    "security-realm" => undefined
    },
    "lb2" => {
    "instance-id" => "lbroute",
    "outbound-socket-binding" => "lbhost2",
    "path" => "/helloworld-html5",
    "scheme" => "http",
    "security-realm" => undefined
    }
    }
    }
    }


    And to complete the configuration I add the location which the handler will handle with the following CLI (setting this so that anything going to the /app URL will be handled):


    /subsystem=undertow/server=default-server/host=default-host/location=\/app:add(handler=lb-handler)

    This we can now see in the settings:


    /subsystem=undertow/server=default-server/host=default-host/location=\/app:read-resource(recursive=true)
    {
    "outcome" => "success",
    "result" => {
    "handler" => "lb-handler",
    "filter-ref" => undefined
    }
    }

    That is all the configuration we need.


    Testing

    To test we use the URL on the LoadBalancer with /app, this should now redirect to the remote servers using /helloworld-html5.  If I then type in a value and press the button I can see which server I have been redirected to.

    We can see when tailing the logs on both the servers that I can refresh the browser which redirects to the other server and it continues in a round robin pattern.


    Summary

    There you go - a straight-forward process to configure JBoss EAP 7 standalone mode as a http load balancer in front of two standalone servers using round robin.


    JBUG - Experience the Potential of JBoss Private Cloud

    $
    0
    0

    As organisers and sponsors of the London JBUG, we were delighted to welcome back one of our most popular speakers, Eric D.Schabell for two talks on Red Hat Private Cloud. In this post, c2b2 Senior Consultant, Brian Randell looks back at the evening and offers a summary of Eric's talks.


    It was a pleasure to host the London JBoss User Group on the 20th September. It was my first time at a JBUG meet-up and my first time hosting - so I wasn't sure entirely what to expect!  

    We assembled at Skills Matter's CodeNode venue which, situated directly in the city near Moorgate Tube, is easy to get to and seemed alive with technical professionals attending conferences, classes and speaker events like ours. I was delighted to see so many attendees - some with laptops out and ready for the live demos.  Once the technician had completed a final check of the cameras and sound and we were away...

    I felt especially privileged to welcome our speaker Eric D. Schabell from Red Hat who was to deliver both talks. Eric travels the world speaking about Red Hat's Integrated Solutions Technology and is a highly respected and engaging speaker, so I knew we were in for a very revealing and informative night.


    The first talk 'A local private PaaS in minutes with Red Hat CDK' had Eric showing us how, by using the Container Development Kit, we could have a private cloud running BPM Suite on an OpenShift pod in minutes!


    By using Vagrant, Kubernetes, Virtual Box, OpenShift Container Platform and BPM Suite, you can deploy a local Virtual Machine, running a RHEL docker container, have OpenShift CP deployed into that container, and deploy a Red Hat BPM suite into a newly created JBoss Pod.

    How easy was that ?! 

    This brings all the benefits of containerisation. You can create and trash them as often as you need, providing an easy way for creating demos, code testing environments, prototyping, and whatever else you may want.

    Eric talked about how having a good container strategy allows you to take control and test your application in as like-for-like environment as you can get.  It's the Red Hat Container Development Kit that allows us this possibility - with the ability to run lots of services at the same and test how they interface and talk to each other.

    The CDK is easy to use and is distributed as a vagrant box.  It can run on the most used platforms, use varying virtualisation providers, and contains examples to help you along.  It really made me want to go try it at home as I build up my own demo systems and playgrounds with which to try things out.  

    See the links below to try it out for yourself.


    After a quick break and a (c2b2 sponsored!) cold beer at the CodeNode {{SpaceBar}} the second talk 'Painless containerization in your very own Private Cloud' expanded on what we had seen with the CDK and put it more into a business context.

    Containers provide a way of allowing environments to be provisioned locally, and be tested on without having to wait for them to be made available by Operations - or be as dependent on other teams.  Using standard images you can concentrate on the things that matter to you.

    The Red Hat Cloud Suite is useful here as it uses the OpenShift Container Platform to provide a simple way to deploy and build applications. You can then rationalise your containers to be more specific to its service, and get them to interact and talk to each other so that you can standardise the interfaces and focus on the container you need to.

    And that was that, a couple of really great talks ending with some great pizza (also sponsored by c2b2) and more drinks, what could be better ?!


    I left the meet-up having had a really good evening. Thanks to Eric for presenting and thanks to all that showed up to listen. Am looking forward to the next one and itching to get playing with the CDK :)

    Eric's talk and slides are available on his blog:


    The evening is available on the Skills Matter website:


    Resources:


    How to Cluster with Cold Fusion

    $
    0
    0

    ColdFusion isn't one of the most commonly used application servers, but one that c2b2 Head of Support, Claudio Salinitro stumbled upon during a troubleshooting engagement he performed for one of our middleware support customers. With a remit to embrace new Java technologies, Claudio spent some time investigating ColdFusion, and here describes how to set up a simple cluster.


    ColdFusion is definitely not one of the most popular enterprise application servers on the market, but despite a few weaknesses and lack of good documentation, in the right scenario, its small footprint and fast development time can make it a very good choice as part of a Java middleware infrastructure.

    In this article, I'm going to cluster two instances using ColdFusion server 2016 with Apache (2.2.31) configured with mod_jk (1.2.41) and do so according to the following logic architecture.


    To accomplish this, I'm going to need...

    • 1x Load Balancer
      Whilst I'm using Apache with mod_jk, any other similar solution would do just fine.
    • 2x ColdFusion server instances
      Depending on your resources and needs, these could be on two different machines, or the same.


    ColdFusion Configuration


    ColdFusion doesn’t have a central admin server like other Java application servers, but instead offers us a “cfusion” instance that is used as a repository for the default configuration, and to create instances and clusters.

    So, from the “cfusion” admin web interface (CFIDE) of node2, create a ColdFusion instance named "instance2".

    From the “cfusion” admin web interface (CFIDE) of node1 create a ColdFusion instance named "instance1" and register "instance2" of the node2 as a remote instance.

    Note - Pay attention to identify the correct HTTP and AJP port, and the JVM Route (double check the server.xml on node2).

    From the “cfusion” admin web interface (CFIDE) of node1 create a cluster, add both "instance1" and "instance2" to the newly created cluster.

    Remember to flag the options “sticky sessions” and “sessions replication” - and to take note of the multicast port...


    Since version 10, ColdFusion no longer uses Jrun, but is running on top of Apache Tomcat, and for this reason, the cluster configuration basically follows the same process as a clean Tomcat installation.
    In the [coldfusion_installation_dir]/instance2/runtime/conf/server.xml file add the following configuration between “</Host>” and “</Engine>”:


    <Cluster channelSendOptions="8" className="org.apache.catalina.ha.tcp.SimpleTcpCluster">
    <Manager className="org.apache.catalina.ha.session.DeltaManager" expireSessionsOnShutdown="false" notifyListenersOnReplication="true" />
    <Channel className="org.apache.catalina.tribes.group.GroupChannel">
    <Membership address="228.0.0.4" port="45564" className="org.apache.catalina.tribes.membership.McastService" dropTime="3000" frequency="500"/>
    <Receiver selectorTimeout="5000" address="node2" autoBind="100" port="4001" className="org.apache.catalina.tribes.transport.nio.NioReceiver" maxThreads="6"/>
    <Sender className="org.apache.catalina.tribes.transport.ReplicationTransmitter">
    <Transport className="org.apache.catalina.tribes.transport.nio.PooledParallelSender"/>
    </Sender>
    <Interceptor className="org.apache.catalina.tribes.group.interceptors.TcpFailureDetector"/>
    <Interceptor className="org.apache.catalina.tribes.group.interceptors.MessageDispatch15Interceptor"/>
    </Channel>
    <Valve filter="" className="org.apache.catalina.ha.tcp.ReplicationValve"/>
    <Valve className="org.apache.catalina.ha.session.JvmRouteBinderValve"/>
    <ClusterListener className="org.apache.catalina.ha.session.ClusterSessionListener"/>
    </Cluster>


    Pay attention that the following has been set up correctly:
    • The membership address and port must be the same between all members of the cluster - so double check the server.xml of "instance1" to make sure they are the same.

    • The receiver element address must be the IP address or the hostname of the related node. This IP must be reachable by the other members of the cluster (no 127.0.0.1 or localhost);

    Then edit the [coldfusion_installation_dir]/instance2/runtime/conf/context.xml and comment out the <Manager></Manager> section. In my case this was:


    <!--<Manager pathname="" />-→


    Do the same on node 1.


    Load Balancer Configuration


    At the moment, the preferred way to configure Apache to work with ColdFusion is using mod_jk - however, Adobe can automatically configure your Apache installation via the wsconfig tool. This can be done during the installation or after, but only works if wsconfig has access to the Apache configuration files - otherwise we can proceed manually.

    The mod_jk binary is shipped in the ColdFusion installation directory. Check into the [coldfusion_installation_dir]/cfusion/runtime/lib/wsconfig.jar to find the binary for your Apache version and operating system.

    Extract the binary in [apache_installation_dir]/modules.

    Then edit the Apache configuration, adding the following:


    LoadModule    jk_module  "[apache_installation_dir]/modules/mod_jk.so"

    JkWorkerProperty worker.list=lb
    JkWorkerProperty worker.instance1.type=ajp13
    JkWorkerProperty worker.instance1.host=192.168.204.131
    JkWorkerProperty worker.instance1.port=8012
    JkWorkerProperty worker.instance1.connection_pool_timeout=60
    JkWorkerProperty worker.instance2.type=ajp13
    JkWorkerProperty worker.instance2.host=192.168.204.129
    JkWorkerProperty worker.instance2.port=8012
    JkWorkerProperty worker.instance2.connection_pool_timeout=60
    JkWorkerProperty worker.lb.type=lb
    JkWorkerProperty worker.lb.balance_workers=instance1,instance2
    JkWorkerProperty worker.lb.sticky_session=false

    JkMount /session_test/* lb


    It’s the standard configuration for mod_jk, to define a module of type “lb” to balance the requests between the other 2 workers - one for the node1 and one for the node2.

    Finally, we map the context /session_test to the load balancer worker so that any request starting with /session_test will/ be balanced on the two ColdFusion nodes.


    Configuration Test


    A note on the “JkWorkerProperty worker.lb.sticky_session” setting:

    The default value usually is “true” because it's preferred to keep the requests of the same client on the same server- and/or depending on your applications, it could be a requirement. In our case we need to test the session replication and the load balancing between the nodes, so that setting will make everything easier.

    I’m going to use the session_test web application provided by Steven Erat in his No Frills Guide to CFMX61 Clustering post, but since this was created for ColdFusion 6, I had to update the code to run on Tomcat.

    On both nodes, create the folder [coldfusion_installation_dir]/[node]/wwwroot/session_test, and inside it create the following five files:

    Application.cfm:


    <cfapplication name="j2ee_session_replication_test" sessionmanagement="Yes" clientmanagement="No">
    <cfscript>
    System = createObject("java","java.lang.System");
    </cfscript>


    index.cfm:

    <cfscript>
    session.currentTimestamp = timeformat(now(),"HH:mm:ss");
    message = "[#session.currentTimestamp#] [#createobject("component","CFIDE.adminapi.runtime").getinstancename()#] [New Session: #session.isnew()#] [id: #session.sessionid#]";
    System.out.println(message);
    WriteOutput(message);
    </cfscript>
    <br><br>System.out has written the above data to the console of the active jrun server
    <br><br><a href="index.cfm">Refresh</a> | <a href="cgi.cfm">CGI</a> | <a href="sessionData.cfm"><cfif not isdefined("session.myData")>Create<cfelse>View</cfif> nested structure</a>
    <br><br>
    <cfif not isDefined("session.session_lock_init_time")>
    <cflock scope="SESSION" type="EXCLUSIVE" timeout="30">
    <cfset session.session_lock_init_time = timeformat(now(),"HH:mm:ss")>
    <cfset session.session_lock_init_servername = #createobject("component","CFIDE.adminapi.runtime").getinstancename()#>
    </cflock>
    </cfif>
    <cfif session.session_lock_init_servername neq #createobject("component","CFIDE.adminapi.runtime").getinstancename()#>
    <CFSET session.session_failedOver_to = #createobject("component","CFIDE.adminapi.runtime").getinstancename()#>
    <br><br>
    <strong><font color="red">
    Session has failed over
    <BR>from <cfoutput>#session.session_lock_init_servername#
    <BR>to #createobject("component","CFIDE.adminapi.runtime").getinstancename()#</cfoutput>
    </font></strong><br><br>
    <cfelseif isDefined("session.session_failedOver_to")>
    <br><br><strong><font color="green">
    Session has been recovered to original server
    after a failover to <cfoutput>#session.session_failedOver_to#</cfoutput>
    </font></strong><br><br>
    </cfif>
    <cfdump var="#session#" label="CONTENTS OF SESSION STRUCTURE">


    cgi.cfm:


    <a href="index.cfm">Back</a><br><br>
    <cfdump var="#cgi#" label="current file path: #getDirectoryFromPath(expandPath("*.*"))#">


    session.cfm:


    <a href="index.cfm">Index</a><br><br>
    <cfdump var="#session#" label="session scope">


    sessionData.cfm:


    <a href="index.cfm">Back</a><br><br>

    <cfscript>
    if(not isdefined("session.myData")){
    writeOutput('<font size="4" color="red">Creating nested session data...</font><br><br>');
    // create deep structure for replication
    a.time1 = now();
    a.time2 = now();
    b.time1 = now();
    b.time2 = now();
    session.myData["ab"]["a"] = a;
    session.myData["ab"]["b"] = b;
    session.myData["a"] = a;
    session.myData["b"] = b;
    session.myData["mydata_session_init_time"] = timeformat(now(),"HH:mm:ss");
    session.myData["mydata_session_init_servername"] = #createobject("component","CFIDE.adminapi.runtime").getinstancename()#;
    }
    </cfscript>

    <br><br><cfdump var="#session.myData#" label="CONTENTS OF SESSION.MYDATA">
    <cfoutput>
    <br><br>Current Time: #timeformat(now(),"HH:mm:ss")#
    <br><br>Current Server: #createobject("component","CFIDE.adminapi.runtime").getinstancename()#
    </cfoutput>


    Then, make multiple attempts to access the following URL:

    http://[load_balancer_host]/session_test/ 

    and test that:

    1. The requests are balanced alternatively between "instance1" and "instance2"
    2. The session created with the first request is replicated between the two nodes (id doesn’t change)
    3. That, in case of failure of one of the two nodes, the requests are sent only to active node;
    4. In case the failed node starts to be active again, the load balancer once again balances the requests on both nodes.

    With this setup you will have a simple but solid ColdFusion infrastructure with high availability thanks to the session sharing. Also in case of increased load, you can easily horizontally scale your setup, adding additional nodes to the cluster and load balancer.

    And on a final note, to separate the client's network traffic from the cluster session replication traffic, the best way forward is to have two dedicated network interfaces. 


    Understanding Java Garbage Collection - Part One

    $
    0
    0
    In this post, c2b2 middleware support specialist, Andy Overton will be taking an introductory look at Java Garbage Collection. Intended to offer a basic understanding of how Garbage Collection works, he'll focus on how to collect GC logs and offer an understanding of what data they contain.


    Before we go any further, let me first say that this post is intended as an introduction to the subject of Garbage Collection - so I won't be going into details about log analysis or the different types of Garbage Collection. Also, note that things have changed somewhat in Java 8 - and I'll look into that more deeply in a future post.


    What is Garbage Collection - and how does it work?


    In languages like C/C++ memory management is left to the developer (known as manual memory management). Languages such as Java and C# utilise Garbage Collection (or GC) to perform automatic memory management - and by Garbage Collection, I mean the process of reclaiming memory occupied by objects that are no longer in use by your code.

    Unsurprisingly, because we provide middleware support services to customers with Java EE infrastructure, I'll be concentrating on GC in Java environments.

    In Java, memory is separated into three areas:

    • Heap Memory - This is used to store the Java objects your program uses
    • Non-Heap Memory (also known as the Permanent Generation) - This is used to store loaded classes and other meta-data
    • Other - This is used to store the JVM code itself, JVM internal structures etc.


    The heap space is further split into the following areas:

    Young Generation:

    • Eden Space - The pool from which memory is allocated for most new objects
    • Survivor Space - The pool containing objects that have survived garbage collection of the Eden space.


    Old/Tenured Generation:

    • The pool containing objects that have existed for some time in the survivor space
    • The lifetime of an object


    So, how does an object move through the spaces?

    The following diagram illustrates this:


    A new object ObjectX is created, this will initially be created in the Eden Space.

    When the Eden Space becomes full (the JVM is unable to allocate space for a new Object) a Minor GC is triggered.

    If ObjectX is still referenced within your code it will be moved to one of the Survivor spaces. Other referenced objects will also be moved to the survivor space.

    Once the survivor space is full, all objects that cannot be collected (including ObjectX) will be moved to the other survivor space, leaving the first survivor space empty.

    This cycle will continue with objects that survive Minor GC being swapped from one survivor space to the other.

    Each Object has an age, and each time it survives Minor GC this is added to.

    Once it reaches a certain number (known as the tenuring threshold) it will be moved to the Tenured generation (by default the tenuring threshold is set to 15).

    When the Tenured generation becomes full a Major GC is triggered. At this point if ObjectX is still referenced it will remain in the Tenured generation. If not, it will be garbage collected.
    Why should I care?


    I hear you ask, "Surely if the JVM is doing all of this automatically, I don't need to worry about it?"

    Well, most of the time, no. However, when GC isn't being done efficiently it can cause some sizable problems.

    The key issue here is that GC is a stop-the-world event - meaning that when GC is taking place, your code stops running. A common misconception is that Minor GCs do not trigger stop-the-world pauses. However, this is untrue (although Minor GCs are optimised, and in general the length of the pauses is negligible). Most of the time spent doing Minor GC is not the cleaning process, but the copying of objects to/from the different spaces. Therefore, if you have a large number of objects that survive Minor GC then these pauses can become much longer.

    Often, people don't care about GC until it becomes an issue. When pauses are small and infrequent they're not noticed, and all is well with the world. However, when users start complaining that your application is running really slowly or your production server falls over with an Out Of Memory error you'll soon learn the importance of understanding GC and how to ensure that it is working in the way you require.

    To see what happens when it goes wrong compile the following code as a jar file:


    import java.util.HashMap;
    import java.util.Map;

    /**
    *
    * @author Andy Overton
    */
    public class MemoryFiller
    {
    private Map<String, String> everGrowingMap;

    private String randomData = "Some random data that will fill up the memory pretty quickly! " +
    "Some random data that will fill up the memory pretty quickly!" +
    "Some random data that will fill up the memory pretty quickly!" +
    "Some random data that will fill up the memory pretty quickly!" +
    "Some random data that will fill up the memory pretty quickly!" +
    "Some random data that will fill up the memory pretty quickly!" +
    "Some random data that will fill up the memory pretty quickly!" +
    "Some random data that will fill up the memory pretty quickly!";

    public MemoryFiller()
    {
    everGrowingMap = new HashMap<>();

    try
    {
    for (long i = 0; i < 1000000000; i++)
    {
    everGrowingMap.put("String-" + i, randomData);

    Thread.sleep(1);
    }
    }
    catch (Throwable t)
    {
    if (t instanceof java.lang.OutOfMemoryError)
    {
    System.out.println("OUT OF MEMORY ERROR! : " + t);
    }
    else
    {
    System.out.println("Exception : " + t);
    }
    }
    }

    /**
    * @param args the command line arguments
    */
    public static void main(String[] args)
    {
    new MemoryFiller();
    }
    }

    To view what's happening when you run this, you can use a tool called JVisualVM. This useful tool comes with the JDK and can be found in the bin directory - but note that you'll need to add the Visual GC plugin. This can be easily done by going to Tools-Plugins.
    Once you have JVisualVM running, run the code with the following parameter in order to set the maximum heap size to 10MB.

    java -Xmx100M -jar MemoryFiller.jar

    Once the code is running you should see it appear under applications in JVisualVM. Click on it and select the Visual GC tab.

    You should then see the Eden Space fill up pretty rapidly until GC occurs and then objects being moved to one of the survivor spaces, this will occur over and over with objects being put into the Old Gen until eventually the Old Gen fills up completely and the program crashes with the following:

    java.lang.OutOfMemoryError: Java heap space

    In JVisualVM you should see something similar to this:


    Now, obviously that code is designed specifically to fill up the memory, but I've seen a number of real world examples of similar things that have caused production servers to crash, managers to question what happened, and support people having no idea!

    Gathering logs


    OK, so you've (hopefully) got a basic understanding of how GC works and can see what happens when things go wrong - but how do we find out what the JVM is doing with regards to GC?

    Well, the JVM already has all of the information you need, you simply need to ask for it. So, in order to turn on GC logging, we generally recommend the following JVM parameters:


    -verbose:gc
    -Xloggc:path_to_log/gc.log
    -XX:+PrintGCDetails
    -XX:+PrintGCTimeStamps
    -XX:+PrintGCDateStamps


    In older versions of Java the GC log files weren't rotated but built-in support has been added to the HotSpot JVM. It is available in:

    • Java 6 Update 34
    • Java 7 Update 2


    There are three new JVM flags that can be used to enable and configure it:

    • XX:+UseGCLogFileRotation - must be used with -Xloggc:<filename>
    • XX:NumberOfGCLogFiles=<number of files> - must be >=1, default is one
    • XX:GCLogFileSize=<number>M (or K) - default will be set to 512K.


    One of the questions we're often asked is 'Does turning GC logging on have an effect on performance?’ The performance impact is negligible. Basically, if the impact is an issue then the issue is with the GC itself rather than you logging what is happening.


    Run the code again adding in the GC logging parameters. You will need to change the path of where to put the log file:


    java -verbose:gc -Xloggc:/home/andy/gc.log -XX:+PrintGCDetails -XX:+PrintGCTimeStamps -XX:+PrintGCDateStamps -Xmx10M -jar MemoryFiller.jar 


    Once the program crashes you will be left with a log file that can be used to see what happened.

    Reading the logs


    Open up the log and you will find lines similar to the following:

    2016-04-08T10:13:19.572+0100: 11.627: [GC [PSYoungGen: 2624K->368K(3008K)] 2624K->1000K(9856K), 0.0023300 secs] [Times: user=0.01 sys=0.00, real=0.00 secs]

    The logs contain information about each time GC takes place in the following format:

    {System Time}: {JVM Time}: [{GC Type} {Starting size}->{Final size} ({Amount freed}) , {time taken in seconds}

    • System Time - The time the GC event occurred
    • JVM Time - Time in seconds since the JVM started
    • GC Type - Either GC (minor) or Full GC (full)
    • Starting Size - Size of the space before GC
    • Final Size - Size of the space after GC
    • Total size - Total space size
    • Heap Starting Size - Size of the heap before GC
    • Heap Final Size - Size of the heap after GC
    • Heap Total size - Total heap size
    • Time Taken - How long the GC took in seconds
    • Times - Duration of GC in different categories (user, sys, real)


    So, in the line above we get the following information:

    • System Time - 2016-04-08T10:13:19.572+0100
    • JVM Time - 11.627
    • GC Type - GC
    • Starting Size - 2624K
    • Final Size - 368K
    • Total size - 3008K
    • Heap Starting Size - 2624K
    • Heap Final Size - 1000K
    • Heap Total size - 9856K
    • Time Taken - 0.0023300 secs
    • Times - 0.01, 0.00, 0.00


    As mentioned earlier, I'm not going to go into details regarding analysing the logs but it's useful to have an understanding of what they contain before you can begin to know what to look for.

    There are a number of good tools out there that you can use for visualising the logs, a list of which can be found here:


     One of the quickest and easiest is gceasy - which is available online at http://gceasy.io/

    This allows you to upload your log file and get a quick analysis report.

    Summary

    Hopefully, you now have a basic understanding of what Garbage Collection is and how it works - and can now collect GC logs, understand what data they contain, and what it means.

    In my next blog I will be taking a look at JDK 1.8 and the changes to memory with the replacement of PermGen with Metaspace.


    Viewing all 223 articles
    Browse latest View live