Quantcast
Channel: C2B2 Blog
Viewing all 223 articles
Browse latest View live

Writing and Deploying a Simple Web Application to GlassFish

$
0
0
Introduction 
       
            This blog will detail how to create a simple Web Application (Web App) on a Windows 7 64 bit system and deploy it to a GlassFish 4.0 server. The web app will be kept simple, so as to keep the focus of the tutorial on the concepts; as such, the web app will provide a web page prompting the user to enter their name and date of birth, before loading another page that repeats their name back at them with their age. The blog will cover how to set up, code, and deploy the web app using the NetBeans IDE, as well as how to manually deploy it using the Windows command prompt. It should be noted that unless stated otherwise, any additional settings that can be changed but are not noted in the guide should be left as their default.

            This guide was written using the following:
  • Windows 7 
  • GlassFish 4.0
  • Java EE 7 32 bit 
  • JDK 1.7.0_45 32 bit 
  • NetBeans 7.4
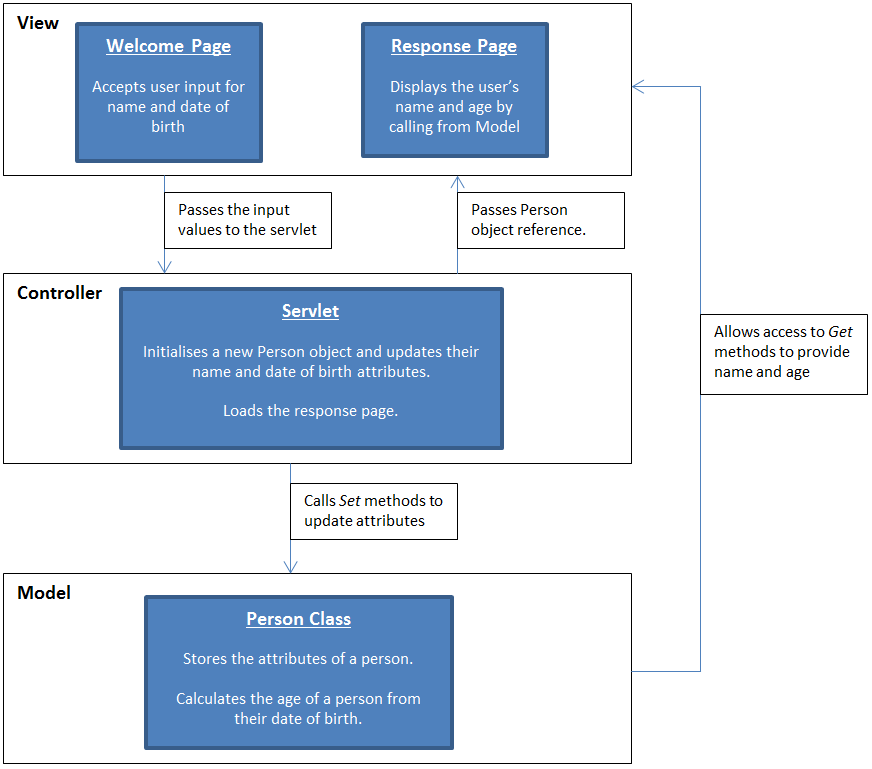
             Though just an introductory tutorial, the web app will be designed with good practices in mind, and so will be designed upon the Model View Controller (MVC) pattern to provide good separation of concerns. As such, the web app will have the following structure:

Diagram showing the architecture of the web app


Step 1: Initial Set up and Configuration
       
            This step covers how to install and configure the software that was used in this blog (excluding Windows!).

Installation

Java

            It is possible to download a bundle that contains the Java SDK and JDK, as well as GlassFish.
  • Go to http://www.oracle.com/technetwork/java/javaee/downloads/index.html
  • To download the SDK, JDK, and GlassFish, click on the download link for Java EE 7 SDK with JDK 7 U45 and select Windows(not Windows x64, this guide is using 32 bit Java).
  •  Install to the default location like any other regular program
    • If you decide to install in a different location, you will have to alter any explicit file paths in the guide to correspond to your own installation location.
    NetBeans IDE

                NetBeans can be downloaded with support for various technologies, and can come bundled with GlassFish 4.0. Feel free to download NetBeans with everything, but for this tutorial only the Java EE version is required.
    • Go to https://NetBeans.org/downloads/index.html
    • Click on the Downloadbutton for Java EE
      •  You may note that this also comes bundled with GlassFish 4.0. Handy, but redundant at this stage if you’ve followed this guide.
    • Install like any other program, to the default location
      • You can configure it not to reinstall GlassFish, or simply leave it as default; reinstalling GlassFish with NetBeans has the positive outcome of NetBeans auto-configuring a default GlassFish Server for you to deploy the web app to, though it does default to a different install location, potentially letting you install GlassFish twice.
    Configuration

    Set Java Environment Variables
                Only really necessary if you are using the command prompt, setting the Java environment variables allows Windows to automatically know where to look for Java and its libraries. Doing this saves you having to explicitly type out the path name to Java whenever you want to use it.
    •  Click on Start, and then right click on Computer and select Properties
    •  Select Advanced System Settings from the list on the left of the window.
    •  Click on Environment Variables
    • Select the Pathvariable under System Variables, and click on Edit
    •  Add the path for the JDK bin – on a default installation that is: C:\Program Files (x86)\Java\jdk 1.7.0_45\bin
      • Ensure there is a semi colon separating out the extra path directory from the previous directory
    It is also prudent to add the JAVA_HOME environment variable whilst here.
    • Click Newunder System Variables
    •  Enter JAVA_HOMEas the variable name
    • Enter the file path of the JDK – on a default installation that is: C:\Program Files (x86)\Java\jdk 1.7.0_45
    GlassFish
                As previously noted, the NetBeans IDE can come bundled with the GlassFish server. This is the simplest method to install and configure GlassFish, as it will automatically set up a default server for us to use. Given that we already have GlassFish installed however, it is possible to add our existing GlassFish server to NetBeans (though if you run into trouble at this step, you could just reinstall NetBeans with the bundled GlassFish).
    • Select Tools, then Servers from the NetBeans toolbar.
    • Select Add Server, on the bottom left of the pop up window.
    • Select GlassFish Server, and press Next.
      • You can leave the Name as the default “GlassFish Server”.
    • Browse to where GlassFish is installed and accept the license agreement before clicking Next.
    • If you let the Java installer install GlassFish, you should find it at: C:\glassfish4
    • Leave the domain location at “Register Local Domain”, and the Domain Name as “domain1”.
    • Enter “admin” as the user name, and a password if you want, before finally clicking Finish.
      • Note – If you let NetBeans set up the server, then when you first start up the server it will set a random String as the password with a username of admin. NetBeans won’t leave you in the dark though, it will auto fill in the password for you when it asks for it.
        • If you want to look at the username or password, you can find them by clicking Tools, then Servers, and selecting the server from the list.
      Setting GlassFish Environment Variables

                  If you intend to run GlassFish from the command prompt, it is recommended to alter the path environment variable to prevent having to move to the GlassFish directory or state the file path whenever you want to use it. This is done using the same method as setting the Java environment variable:
      • Click on Start, and then right click on Computer and select Properties
      • Select Advanced System Settings from the list on the left of the window.
      •  Click on Environment Variables
      • Select the Pathvariable under System Variables, and click on Edit
      • Enter the file path of the GlassFish bin folder
        • NetBeans Install: C:\Program Files (x86)\glassfish-4.0\bin
        • Java Install: C:\glassfish4\bin
      • Enter the file path of the GlassFish server
        • NetBeans Install: C:\Program Files (x86)\glassfish-4.0\glassfish
        • Java Install: C:\glassfish4\glassfish
      Creating a NetBeans Project
                  Before we begin writing any code, we must create a project in which to store and organise our files.
      • Click on File, then New Project.
        • Alternatively, use the keyboard shortcut Ctrl + Shift + N, or click on the New Project icon.
      • From within the popup window, select Java Webfrom the Categories list, and then Web Application from the Projects list.
      • Give your project a name, you can leave it as the default or give it your own name. For this blog, I will be naming it SimpleWebApp.
      • Once you have entered a name, click Next.
      • Select GlassFish Server and Java EE 7 Web as the Server and Java EE version respectively, before clicking Finish.

                If all is well, the project should be successfully created and will appear in the Projects pane on the left hand side of the IDE. An html file called indexwill also be created and opened in the main IDE view ready for editing, though we will leave this for now.

        Step 2: Writing the Application Body
               
                    This steps covers and explains the code that provides the workings for our web app.

        The Person Class
               
                    This class is a JavaBean, a Java class designed to enable easy reuse that conforms to a specific standard: It has a constructor that takes no arguments, properties that are accessed through Gettersand Setters, and is Serializable. In our web app, the class is used to store information about the user, and allows other classes and pages to update and get information from it through Getter and Setter methods. To begin, we need to create the class for the code to go into:
        • Right click on the project, SimpleWebApp, hover over New to expand the list, and select JavaClass.
        • Enter Person as the class name, and enter org.mypackage.models as the package.
        • Click Finish to create the class.
                    To conform to the JavaBean standard, we need the class to implement Serializable, so add implements Serializable after the class declaration.
         public class Person implements Serializable  
                    NetBeans will display that Serializable is causing an error. This is because we haven’t imported the interface, or specified its path. We can get NetBeans to do this for us by clicking on the offending line, pressing Alt and Enter together, and selecting to add the import for java.io.Serializable.

                    Now that we have a class to work with, we can begin filling out the code:
        • Declare private variables of the following:
          • A String called name– This will be used to store the name of the user
          • A byte called age– This will be used to store the age of the user once it has been calculated. Unless filling in an obscure date of birth, a person is not realistically going to be over 127 years old, so only a byte is needed.
          • A String called dateOfBirth– This will be the String representation of the user given date of birth.
          • A Calendar called birthday– This will be the Calendar representation of the user’s date of birth, a more workable format for a date of birth.
          • A DateFormat called birthdateFormat– The accepted format of the user’s date of birth.
          • A Date called birthdate– This is the date of birth in a Date Format, used for converting the date of birth from a String to a Calendar.
          • A Calendar called todaysDate– Stores today’s date, used for calculating the age of the user.
               
                    At this time the Calendar, DateFormat, and Date will be underlined with a red line signifying an error. This is, again, because we haven’t imported the classes or specified their paths. Add the imports for java.util.Calendar, java.text.java.text.DateFormat, and java.util.Date respectively.
        • Create a constructor with no arguments, initialising the variables as:
         name = "";  
        age = 0;
        birthday = GregorianCalendar.getInstance();
        birthdateFormat = new SimpleDateFormat("yyyy-MM-dd");
        dateOfBirth = birthdateFormat.format(new Date());
        birthdate = new Date();
        todaysDate = GregorianCalendar.getInstance();
                    Errors will be thrown up for SimpleDateFormat and GregorianCalendar, import the classes java.text.SimpleDateFormat and java.util.GregorianCalendar in the same way as before to resolve these errors. We now need to create the Getter and Setter methods to allow access to the class properties, and NetBeans provides us with a handy way to generate these to save us typing it out:
          Window showing the settings for encapsulating the fields
        • Right click on the name variable in the Source Editor in the bottom left of NetBeans, expand the Refactor list, and click on Encapsulate Fields. This window displays the variables in the class that can be encapsulated, providing the means to generate Getter and Setter methods for variables, and to automatically set the visibility of said variables, Getter, and Setter methods. We can leave the default settings, but with two additions:
          • Create a Getterfor age– We don’t need a Setter as this is calculated inside the class, not set by an external controller.
          • Create a Setterfor dateOfBirth– We don’t need a Getter within the scope of this tutorial, as we don’t have any pages that will access this attribute.
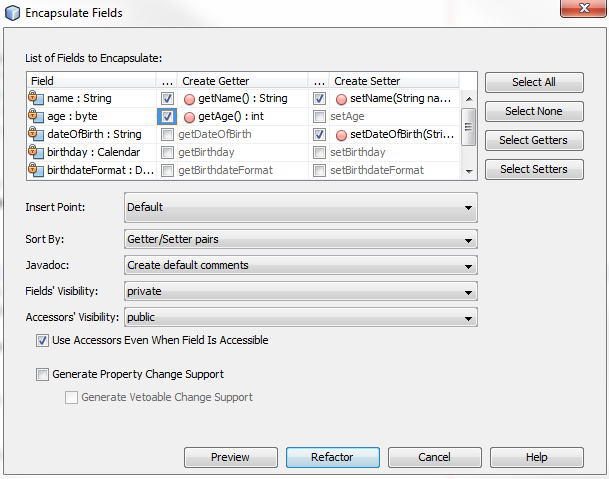
        • Click Refactor to generate the code. Were our variables not already declared as private, the selection of private for the Field Visibility would have declared them as such for us. This will also have added JavaDoc annotations, metadata, for the Getter and Setter methods. 

                    The code so far should look like this (minus the comments):
         package org.mypackage.models;  

        import java.io.Serializable;
        import java.text.DateFormat;
        import java.text.SimpleDateFormat;
        import java.util.Calendar;
        import java.util.Date;
        import java.util.GregorianCalendar;


        public class Person implements Serializable
        {
        private String name; // The name of the user
        private byte age; // The age of the user
        private String dateOfBirth; // The date of birth of the user
        private Calendar birthday; // The birthday of the user
        private DateFormat birthdateFormat; // The format of the birth date
        private Date birthdate; // The dateOfBirth in a Date format
        private Calendar todaysDate; // Todays date

        // Initialise any variables with default values
        public Person()
        {
        name = "";
        age = 0;
        birthday = GregorianCalendar.getInstance();
        birthdateFormat = new SimpleDateFormat("yyyy-MM-dd");
        dateOfBirth = birthdateFormat.format(new Date());
        birthdate = new Date();
        todaysDate = GregorianCalendar.getInstance();
        }

        // The Getter method for the name
        public String getName()
        {
        return name;
        }

        // The Setter method for the name
        public void setName(String name)
        {
        this.name = name;
        }

        // The Getter method for the age
        public int getAge()
        {
        return age;
        }

        // The Setter method for the date of birth
        public void setDateOfBirth(String dateOfBirth)
        {
        this.dateOfBirth = dateOfBirth;
        }

                    As noted previously, as the age attribute is not set by a servlet, we need to provide a method to calculate the age of the user from their supplied date of birth.
        • Create a private void method calculateAge().
        • Create a try clause – as we are parsing from a String to a Date, we need to catch a Parse Exception if one is thrown.
        • Within the try clause:
          • Parse the dateOfBirth String in the format of birthdateFormat, and set this as birthdate
         birthdate = birthdateFormat.parse(dateOfBirth);  
          • Use the setTime method of Calendar to set the birthday variable as the formatted Date value of birthdate
         birthday.setTime(birthdate);  
        • End the try clause and catch the exception with a basic message (bad practice as exceptions should not just be ignored like this, but for this demo we can get away with it).
           catch (ParseException ex)   
          {
          System.out.println("Parse Exception when parsing the dateOfBirth");
          }
                      With the String now parsed to a Calendar, we can make use of the Calendar methods to extract the year from the birthday and today’s date to calculate the user’s age.
          • Subtract the year of the user’s date of birth from today’s year to get the difference in years, before then casting it as a byte. Set the age variable as this value.
           age = (byte)(todaysDate.get(Calendar.YEAR) - birthday.get(Calendar.YEAR));  
                      To accurately give the user’s age we need to take into account the day and month, else with the current method it is possible to give the user’s age as a year too high.
          • Add the agevariable, currently representing the difference in years, to the user’s date of birth, the birthday variable, to get the user’s birthday for this year.
           birthday.add(Calendar.YEAR, age);  
          • Compare today’s date against the user’s birthday this year, using the todaysDate and birthday variables respectively, to see if today’s date is before the user’s birthday, decrementing age if it is.
           if (todaysDate.before(birthday))  
          {
          age --;
          }
            The method should now look like this:
          private void calculateAge()  
          {
          try
          {
          // Convert the user supplied date of birth String to a Date in the specified format
          birthdate = birthdateFormat.parse(dateOfBirth);

          // Cast the Date value to a Calendar to allow easier use
          birthday.setTime(birthdate);
          }

          catch (ParseException ex)
          {
          System.out.println("Parse Exception when parsing the dateOfBirth");
          }

          // Calculate the age
          age = (byte)(todaysDate.get(Calendar.YEAR) - birthday.get(Calendar.YEAR));

          // Get the date of the user's birthday this year
          birthday.add(Calendar.YEAR, age);

          // Check if the user's birthday has passed this year
          if (todaysDate.before(birthday))
          {
          // Reduce the age by one if it hasn't
          age --;
          }
          }

                      Only one final thing remains to complete the Person class:
          • Add in the method call for calculateAge before the returnstatement in the getAge() method.
           calculateAge();  
                      The final code for this class should look like this:
           package org.mypackage.models;  

          import java.io.Serializable;
          import java.text.DateFormat;
          import java.text.ParseException;
          import java.text.SimpleDateFormat;
          import java.util.Calendar;
          import java.util.Date;
          import java.util.GregorianCalendar;


          public class Person implements Serializable
          {
          private String name; // The name of the user
          private byte age; // The age of the user
          private String dateOfBirth; // The date of birth of the user
          private Calendar birthday; // The birthday of the user
          private DateFormat birthdateFormat; // The format of the birth date
          private Date birthdate; // The dateOfBirth in a Date format
          private Calendar todaysDate; // Todays date

          // Initialise any variables with default values
          public Person()
          {
          name = "";
          age = 0;
          birthday = GregorianCalendar.getInstance();
          birthdateFormat = new SimpleDateFormat("yyyy-MM-dd");
          dateOfBirth = birthdateFormat.format(new Date());
          birthdate = new Date();
          todaysDate = GregorianCalendar.getInstance();
          }

          // The Getter method for the name
          public String getName()
          {
          return name;
          }

          // The Setter method for the name
          public void setName(String name)
          {
          this.name = name;
          }

          // The Getter method for the age
          public int getAge()
          {
          // Call the method to calculate the age before returning it
          calculateAge();

          return age;
          }

          // The Setter method for the date of birth
          public void setDateOfBirth(String dateOfBirth)
          {
          this.dateOfBirth = dateOfBirth;
          }

          // The method that calculates the user's age from their date of birth
          private void calculateAge()
          {
          try
          {
          // Convert the user supplied date of birth String to a Date in the specified format
          birthdate = birthdateFormat.parse(dateOfBirth);

          // Cast the Date value to a Calendar to allow easier use
          birthday.setTime(birthdate);
          }

          catch (ParseException ex)
          {
          System.out.println("Parse Exception when parsing the dateOfBirth");
          }

          // Calculate the age
          age = (byte)(todaysDate.get(Calendar.YEAR) - birthday.get(Calendar.YEAR));

          // Get the date of the user's birthday this year
          birthday.add(Calendar.YEAR, age);

          // Check if the user's birthday has passed this year
          if (todaysDate.before(birthday))
          {
          // Reduce the age by one if it hasn't
          age --;
          }
          }
          }

          The PersonServlet Class

          A servlet is, like a JavaServer Page, a means of enabling dynamic content in a web application. The servlet in our application takes the user input from the HTML index page and updates the attributes of a Person object, before loading a new web page to display the response.
          • Right click on the Project in the Projects pane, expand the New list, and select Servlet.
          • Provide a Class Name of PersonServlet, a Package of org.mypackage.controllers, and click Next
          • Check the box to Add information to deployment descriptor to generate the XML code providing the means of accessing the servlet from the indexpage.
                      Click finish to create our servlet and generate default methods and imports. The processRequest method will be filled with default out statements from a PrintWriter, which you should delete as we don’t need them. This method takes the requests, wrapped as objects, from HTTP GET and POST methods as a parameter, thus allowing us to process them before giving a response.
          • Declare the private variables for the servlet to take in from the index page, name and dateOfBirth.
            • Declare and initialise the private variable to be used to identify what will be our Person object when passed to another page, personID.
             private String name;  // The user's name  
            private String dateOfBirth; // The user's date of birth
            private String personID = "personBean"; // The ID of the Person object
                        As you can read from the generated JavaDoc for the processRequest method, it processes requests for both the GETand POST HTTP methods, so let’s process what will be a GET request from our index page.
            • Initialise the name and dateOfBirth variables as the parameters of the same name from the HTTP request, with the getParameter method (be sure to put the parameters between ""!).
             name = request.getParameter("name");  
            dateOfBirth = request.getParameter("dateOfBirth");
                          Initialise a Person object for use by the servlet. If you’re sharp you’ll remember having put it in another package, so be sure to provide the full path or import the package.
                import org.mypackage.models.Person; 

                Person person = new Person();  
                • With the Person object initialised, utilise its Setter methods to update the name and dateOfBirth attributes with those supplied by the user.
                 person.setName(name);  
                person.setDateOfBirth(dateOfBirth);
                            With the attributes set, we need to pass control to another page to load the response for this specific Person object. To accomplish this, we set our person object and its identifier, personID, as attributes of the request, and pass control to the new page.
                • Set personID and person as attributes of the request.
                 request.setAttribute(personID, person);  
                • Pass control to what will be our responding page, userAgeResponse.jsp, and forward the request and response parameters to it.
                 RequestDispatcher dispatcher = getServletContext().getRequestDispatcher("/userAgeResponse.jsp");  
                dispatcher.forward(request, response);
                            The final code for the PersonServlet (excluding the unchanged default methods) should look like this:

                 package org.mypackage.controllers; 

                import java.io.IOException;
                import javax.servlet.RequestDispatcher;
                import javax.servlet.ServletException;
                import javax.servlet.annotation.WebServlet;
                import javax.servlet.http.HttpServlet;
                import javax.servlet.http.HttpServletRequest;
                import javax.servlet.http.HttpServletResponse;
                import org.mypackage.models.Person

                // Specify the name of the servlet and the URL for it
                @WebServlet(name = "PersonServlet", urlPatterns = {"/PersonServlet"})
                public class PersonServlet extends HttpServlet {

                private String name; // The user's name
                private String dateOfBirth; // The user's date of birth
                private String personID = "personBean"; // The ID of the Person object

                /**
                * Processes requests for both HTTP <code>GET</code> and <code>POST</code>
                * methods.
                *
                * @param request servlet request
                * @param response servlet response
                * @throws ServletException if a servlet-specific error occurs
                * @throws IOException if an I/O error occurs
                */
                protected void processRequest(HttpServletRequest request, HttpServletResponse response)
                throws ServletException, IOException
                {
                // Retrieve the user input values from the Welcome Page
                name = request.getParameter("name");
                dateOfBirth = request.getParameter("dateOfBirth");

                // Initialise a new Person object
                Person person = new Person();

                // Update the default values in the Person object with the user supplied values
                person.setName(name);
                person.setDateOfBirth(dateOfBirth);

                // Set the person object and its identifier as attributes of the request
                request.setAttribute(personID, person);

                // Load the userAgeResponse Page
                RequestDispatcher dispatcher = getServletContext().getRequestDispatcher("/userAgeResponse.jsp");
                dispatcher.forward(request, response);
                }

                // … Default HttpServlet methods …

                }

                Step 3: Configuring the Web Pages
                       
                            Now that we have our classes that store the inputted attributes and control our web app, we need to configure the web pages that will use them!

                Creating and Configuring the userAgeResponse Page

                            The userAgeResponse page will be the page that is loaded once the user has submitted their name and date of birth, displaying in turn the user’s name back at them with their age. We begin, as usual, by creating a new file for our project:
                • Right click the SimpleWebApp node in the Projects window, expand the New list, and click on JSP, short for JavaServer Page.
                • Name the JSP userAgeResponse, leave the other settings as default, and click Finish.
                This creates the JSP and opens it in the editor for us to tinker with. Feel free to give the page a title, though it doesn’t actually affect the functionality at all. NetBeans allows us to generate HTML and other useful web content functions by dragging them from a window called the Palette into the editor at the point we want them generated. We will make use of this to save us typing out the code to utilise the JavaBean we created earlier:
                • Open the palette by clicking on Window from the NetBeans toolbar, expand the IDE Tools list, and select Palette
                  • This can also be done with the keyboard shortcut Ctrl + Shift + 8
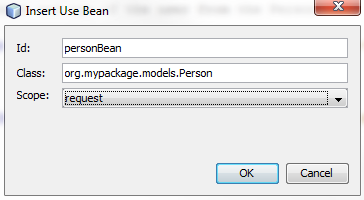
                  Window showing the settings for inserting a Use Bean
                • Expand the JSP tab, and drag a Use Bean into the editor above the HTML tags of the page. A window will appear, enter personBean as the ID, org.mypackage.models.Person as the Class, and set the Scope to request. This will be used to access, as you may be able to tell from the parameters, the Person class, and the Get and Set methods within it. It will in particular be accessing the person object we created and sent to the page from our servlet, utilising the ID of personBean, which was the value of personID passed to it from the servlet.
                <jsp:useBean id="personBean" scope="request" class="org.mypackage.models.Person" />  
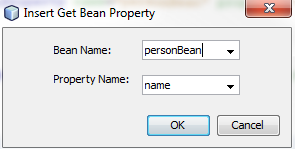
                • Drag two Get Bean Propertys between the bodytags with the Bean Name for both set to personBean, and the Property Name set as name for one, and age for the other. This calls the Getter method, for the nameand age attributes respectively, from the class of the object with the ID specified in the Use Bean, person.  
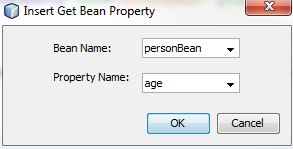
                Window showing the settings for creating a Get Bean Property
                Window showing the settings for creating a Get Bean Property
                <jsp:getProperty name="personBean" property="name" />  
                <jsp:getProperty name="personBean" property="age" />
                • Add some friendly text and a line break between the two Get Bean Properties for ease of reading to finish off the page.
                 Hello <jsp:getProperty name="personBean" property="name" />!  

                <br>

                You are <jsp:getProperty name="personBean" property="age" /> years old!
                And with that, we have completed the userAgeResponse page, and it should look like this:

                <%@page contentType="text/html" pageEncoding="UTF-8"%>  
                <!DOCTYPE html>

                <!--
                Gain access to the person object
                -->
                <jsp:useBean id="personBean" scope="request" class="org.mypackage.models.Person" />

                <html>
                <head>
                <meta http-equiv="Content-Type" content="text/html; charset=UTF-8">
                <title>Your Age</title>
                </head>
                <body>

                <!--
                Pull the name and age of the user from the Person object
                -->
                Hello <jsp:getProperty name="personBean" property="name" />!

                <br>

                You are <jsp:getProperty name="personBean" property="age" /> years old!

                </body>
                </html>


                Configuring the Index Page
                       
                            With a page that responds to the user, we need to finish our web app by configuring our front web page, the indexpage, to allow user input. Navigate to the indexpage in the IDE, and again feel free to supply the page with a title. NetBeans can help us out again by providing means of generating much of the code to supply user input for us:
                  Window showing the settings for creating an input form
                • Open up the Palette if it isn’t already open, and expand the HTML Forms menu. Remove any default text inside of the body of the code, before pulling a Form into the body from the Palette. Set our servlet, PersonServlet, as the Action, GET as the Method, and give it a Name of inputForm. This specifies that the inputs from this form will be sent to our servlet via the HTTP GET method.
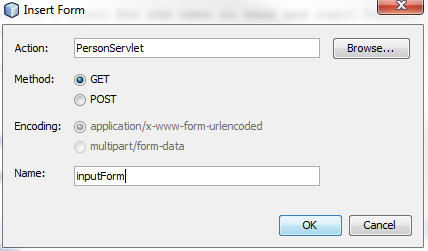
                <form name=“Input Form” action=“PersonServlet”>  

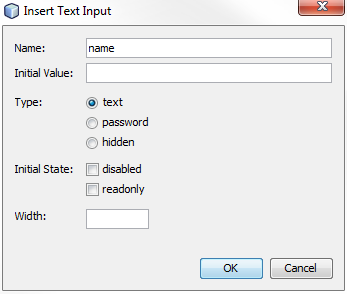
                Window showing the settings for creating a text input field
                • Make some space between the form tags, and place a Text Input item inside. Give the input a Name of name, and hit OK, leaving the other fields as default. The Name field in this instance is giving the variable name to be passed, so is the same name parameter extracted from the HTTPServletRequestrequestin our servlet.

                  <input type=“text” name=“name” value=“” />  

                              You may remember that we took in two parameters from the HTTPServletRequest in our servlet, the other being dateOfBirth.
                  • Create another Text Input with the name of dateOfBirthto satisfy this foresight of ours. Once generated, alter the type from text to date, providing some input validation, and provide it a default date value of the format yyyy-mm-dd to give the user a visual cue of the input format if the browser does not support providing automatic formatting for the HTML date tag. 
                  <input type=“date” name=“dateOfBirth” value=“2014-01-29” />  
                  • Type in some descriptive text before the text inputs to give the input fields a label for the user to see, and place a line break between the fields to improve readability.
                   Enter Your Name: <input type="text" name="name" value="" />  

                  <br>

                  Enter Your Date of Birth: <input type="date" name="dateOfBirth" value="2014-01-29" />
                    Window showing the settings for creating a submit button
                  • Finally, place another line break after the text inputs and drag a Button in, giving it a Label of Submit, leaving the Typeas Submit, and a Name of submitButton.
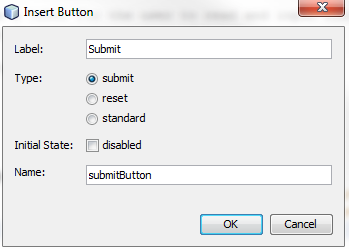
                  <input type=”submit” value=”OK” />  

                              With that, our index page, and our web app, are done! See below for what the code of the index page should look like:

                  <!DOCTYPE html>  
                  <html>
                  <head>
                  <title>Welcome Page</title>
                  <meta charset="UTF-8">
                  <meta name="viewport" content="width=device-width">
                  </head>
                  <body>

                  <!--
                  Create an input form to take in the user's name and date of birth
                  and send them to the servlet
                  -->
                  <form name="Input Form" action="PersonServlet">

                  <!--
                  Provide a label for the user to read and input fields,
                  passing on the name and date of birth
                  -->
                  Enter Your Name: <input type="text"
                  name="name"
                  value="" />

                  <br>

                  Enter Your Date of Birth: <input type="date"
                  name="dateOfBirth"
                  value="2014-01-29" />

                  <br>

                  <!--
                  Provide a button as a means of submitting the user's data
                  -->
                  <input type="submit" value="Submit" name="Submit Button"/>

                  </form>
                  </body>
                  </html>

                  Step 4: Deploying the Web App
                         
                              This section will be split into two sections detailing two methods of deploying the application: the “manual” method, utilising the command prompt, and the “IDE” method, utilising NetBeans.

                  IDE
                         
                              To deploy the web app to the GlassFish server, simply press the Run button. This starts up the GlassFish server and deploys the web app to the server using directory deployment before opening your web browser at the indexpage. Directory deployment is deploying a web app to the GlassFish server by utilising a structured directory instead of a web archive file (WAR). Alternatively:

                  • Right click on the project in the Projects pane, and click on deploy. This will start the GlassFish server, if it isn’t already running, undeploy any current version of the web app already deployed, and deploy the web app to the server.
                  • Click on the Run button, and the web app will now load in your browser.
                  Manual
                         
                              To begin with, we need to build the project, creating a WAR file. A WAR file is a type of Java Archive file (JAR) containing a packaged web application; it is an archive composed of the JSP, HTML and other files of the web application, as well as a runtime deployment descriptor (XML file) describing to the application server how to run the web app.
                  • In NetBeans, right click on the project in the Projects window and click on Clean and Build.
                              This creates the WAR file by default in a new folder, dist, under the project folder in NetBeansProjects, found in Documents. Open up the command prompt and, assuming you have set the GlassFish path environment variables, the following steps should start the server and deploy the web app. Note, you may need to run the command prompt as an administrator to get the server to start.
                  • Enter the command asadmin start-domain. The asadmin command is a GlassFish utility that lets you run administrative tasks, such as starting and stopping servers. As we are using the default GlassFish server, domain1, we do not need to enter a domain name.
                  • Navigate to the dist folder containing the SimpleWebApp.war file.
                    • Alternatively you can type out the file path to SimpleWebApp.war each time it is used.
                  • Type the command asadmin deploySimpleWebApp.war.
                    • If the SimpleWebApp is already deployed, you can force a redeploy using the following command - asadmin deploy --force=true SimpleWebApp.war.
                  • Open your browser and navigate to http://localhost:8080/SimpleWebApp  
                   Done!

                              And with that, you have created a web app and (hopefully!) seen the satisfying "Command deploy executed successfully" message, signifying that you have just deployed your hard work to a GlassFish application server!


                  Andrew Pielage


                  Graduate Support Consultant
                    Swiss Java Knife - A useful tool to add to your diagnostic tool-kit?

                    $
                    0
                    0
                    Introduction

                    As a support consultant I am always looking for handy tools that may be able to help me or my team in diagnosing our customers middleware issues. So, when I came across a project called Swiss Java Knife promising tools for 'JVM monitoring, profiling and tuning' I figured I should take a look. It's basically a single jar file that allows you to run a number of tools most of which are similar to the ones that come bundled with the JDK.

                    If you're interested in those tools my colleague Matt Brasier did a good introductory webinar which is available here:

                    http://www.c2b2.co.uk/jvm_webinar_video

                    Downloading

                    Firstly I downloaded the latest jar file from github:

                    https://github.com/aragozin/jvm-tools

                    The source code is also available but for the purposes of this look into what it can offer the jar will suffice.

                    What does it offer?

                    Swiss Java Knife offers a number of commands:

                    jps - Similar to the jps tool that comes with the JDK.
                    ttop - Similar to the linux top command.
                    hh - Similar to running the jmap tool that comes with the JDK with the -histo option.
                    gc - Reports information about GC in real time.
                    mx - Allows you to do basic operations with MBeans from the command line.
                    mxdump - Dumps all MBeans of the target java process to JSON.

                    Testing

                    In order to test out the commands that are available I set up a Weblogic server and deployed an app containing a number of servlets that have known issues. These are then called via JMeter to show certain server behaviour:
                    • excessive Garbage Collection
                    • high CPU usage
                    • a memory leak

                    Finding the process ID

                    Normally to find the process ID I'd use the jps command that comes with the JDK.

                    Swiss Java Knife has it's own version of the jps command so I tried that instead.

                    Running the command:

                    java -jar sjk-plus-0.1-2013-09-06.jar jps

                    gives the following output:

                    5402org.apache.derby.drda.NetworkServerControl start
                    3250weblogic.Server
                    4032./ApacheJMeter.jar
                    3172weblogic.NodeManager -v
                    5427weblogic.Server
                    6523sjk-plus-0.1-2013-09-06.jar jps

                    Which is basically the same as running the jps command with the -l option.

                    There are a couple of additions where you can add filter options allowing you to pass in wild cards to match process descriptions or JVM system properties but overall it adds very little to the standard jps tool.
                    jps -lv will generally give you everything you need.

                    OK, so now we've got the process ID of our server we can start to look at what is going on. First of all, lets check garbage collection.

                    Checking garbage collection

                    OK. Now this one looks more promising. Swiss Java Knife has a command for collecting real time GC statistics. Let's give it a go.

                    So, running the following command without my dodgy servlet running should give us a 'standard' reading:

                    java -jar sjk-plus-0.1-2013-09-06.jar gc -p 3016

                    [GC: PS Scavenge#10471 time: 6ms interval: 113738ms mem: PS Survivor Space: 0k+96k->96k[max:128k,rate:0.84kb/s] PS Old Gen: 78099k+0k->78099k[max:349568k,rate:0.00kb/s] PS Eden Space: 1676k-1676k->0k[max:174464k,rate:-14.74kb/s]]
                    [GC: PS MarkSweep#10436 time: 192ms interval: 40070ms mem: PS Survivor Space: 96k-96k->0k[max:128k,rate:-2.40kb/s] PS Old Gen: 78099k+7k->78106k[max:349568k,rate:0.19kb/s] PS Eden Space: 0k+0k->0k[max:174400k,rate:0.00kb/s]]

                    PS Scavenge[ collections: 31 | avg: 0.0057 secs | total: 0.2 secs ]
                    PS MarkSweep[ collections: 9 | avg: 0.1980 secs | total: 1.8 secs ]

                    OK. Looks good. Useful to be able to get runtime GC info without having to rely on GC logs which are often not available.

                    After running my dodgy servlet (containing a number System.gc() calls) we see the following:

                    [GC: PS Scavenge#9787 time: 5ms interval: 38819ms mem: PS Survivor Space: 0k+64k->64k[max:192k,rate:1.65kb/s] PS Old Gen: 78062k+0k->78062k[max:349568k,rate:0.00kb/s] PS Eden Space: 204k-204k->0k[max:174336k,rate:-5.28kb/s]]
                    [GC: PS MarkSweep#10200 time: 155ms interval: 112488ms mem: PS Survivor Space: 64k-64k->0k[max:192k,rate:-0.57kb/s] PS Old Gen: 78071k+0k->78071k[max:349568k,rate:0.00kb/s] PS Eden Space: 0k+0k->0k[max:174336k,rate:0.00kb/s]]

                    PS Scavenge[ collections: 666 | avg: 0.0046 secs | total: 3.1 secs ]
                    PS MarkSweep[ collections: 689 | avg: 0.1588 secs | total: 109.4 secs ]

                    A big difference and although not a particularly realistic scenario it's certainly a useful tool for being able to quickly view runtime GC info.

                    Next up we'll take a look at CPU usage.

                    Checking CPU usage

                    Swiss Java Knife has a command that works in a similar way to the linux top command which displays the top CPU processes.

                    Running the following command should give us the top 10 CPU processes when running normally:

                    java -jar sjk-plus-0.1-2013-09-06.jar ttop -n 10 -p 5427 -o CPU

                    2014-03-11T08:56:33.120-0700 Process summary
                      process cpu=2.21%
                      application cpu=0.67% (user=0.30% sys=0.37%)
                      other: cpu=1.54%
                      heap allocation rate 245kb/s
                    [000001] user= 0.00% sys= 0.00% alloc=     0b/s - main
                    [000002] user= 0.00% sys= 0.00% alloc=     0b/s - Reference Handler
                    [000003] user= 0.00% sys= 0.00% alloc=     0b/s - Finalizer
                    [000004] user= 0.00% sys= 0.00% alloc=     0b/s - Signal Dispatcher
                    [000010] user= 0.00% sys= 0.00% alloc=     0b/s - Timer-0
                    [000011] user= 0.00% sys= 0.01% alloc=    96b/s - Timer-1
                    [000012] user= 0.00% sys= 0.01% alloc=    20b/s - [ACTIVE] ExecuteThread: '0' for queue: 'weblogic.kernel.Default (self-tuning)'
                    [000013] user= 0.00% sys= 0.00% alloc=     0b/s - weblogic.time.TimeEventGenerator
                    [000014] user= 0.00% sys= 0.04% alloc=   245b/s - weblogic.timers.TimerThread
                    [000017] user= 0.00% sys= 0.00% alloc=     0b/s - Thread-7

                    So far so good, minimal CPU usage. Now I'll run my dodgy servlet and run it again:

                    Hmmm, not so good:

                    Unexpected error: java.lang.IllegalArgumentException: Comparison method violates its general contract!

                    Try once again and we get the following:

                    2014-03-11T09:00:10.625-0700 Process summary
                      process cpu=199.14%
                      application cpu=189.87% (user=181.57% sys=8.30%)
                      other: cpu=9.27%
                      heap allocation rate 4945kb/s
                    [000040] user=83.95% sys= 2.82% alloc=     0b/s - [ACTIVE] ExecuteThread: '5' for queue: 'weblogic.kernel.Default (self-tuning)'
                    [000038] user=93.71% sys=-0.44% alloc=     0b/s - [ACTIVE] ExecuteThread: '3' for queue: 'weblogic.kernel.Default (self-tuning)'
                    [000044] user= 3.90% sys= 4.91% alloc= 4855kb/s - RMI TCP Connection(5)-127.0.0.1
                    [000001] user= 0.00% sys= 0.00% alloc=     0b/s - main
                    [000002] user= 0.00% sys= 0.00% alloc=     0b/s - Reference Handler
                    [000003] user= 0.00% sys= 0.00% alloc=     0b/s - Finalizer
                    [000004] user= 0.00% sys= 0.00% alloc=     0b/s - Signal Dispatcher
                    [000010] user= 0.00% sys= 0.00% alloc=     0b/s - Timer-0
                    [000011] user= 0.00% sys= 0.04% alloc=  1124b/s - Timer-1
                    [000012] user= 0.00% sys= 0.00% alloc=     0b/s - [STANDBY] ExecuteThread: '0' for queue: 'weblogic.kernel.Default (self-tuning)'

                    So, the CPU usage is now through the roof (as expected).

                    The main issue with this is that similar to the jps command it doesn't really offer much more than the top command. It also threw the exception above many times when trying to run commands ordered by CPU.

                    Overall, it doesn't really add much to the command already available and unexpected errors are never good.

                    Finally, we'll take a look at memory usage.

                    Checking memory usage

                    For checking memory usage Swiss Java Knife has a tool called hh which it claims is an extended version of jmap -histo. For those not familiar with jmap, it's another of the tools that comes with the JDK which prints shared object memory maps or heap memory details for a process.

                    So, first of all I run my JMeter test that repeatedly calls my dodgy servlet. This time one that allocates multiple byte arrays each time it's called to simulate a memory leak.

                    Although it claims to be an extended version of jmap -histo the only real addition is the ability to state how many buckets to view but this can be easily achieved by piping the output of jmap -histo through head. Aside from that the output is virtually identical.

                    Output from jmap:

                     num     #instances         #bytes  class name
                    ----------------------------------------------
                       1:         42124      234260776  [B
                       2:        161472       24074512  <constMethodKlass>
                       3:        161472       21970928  <methodKlass>
                       4:         12853       15416848  <constantPoolKlass>
                       5:         12853       10250656  <instanceKlassKlass>
                       6:         84735        9020400  [C
                       7:         10896        8943104  <constantPoolCacheKlass>
                       8:         91873        2939936  java.lang.String
                       9:         14021        1675576  java.lang.Class
                      10:         10311        1563520  [Ljava.lang.Object;

                      Output from sjk:

                      java -jar sjk-plus-0.1-2013-09-06.jar hh -n 10 -p 5427

                        1:         56626      386286072  [B
                       2:        161493       24076192  <constMethodKlass>
                       3:        161493       21973784  <methodKlass>
                       4:         12850       15409912  <constantPoolKlass>
                       5:         12850       10249384  <instanceKlassKlass>
                       6:         10891        8936672  <constantPoolCacheKlass>
                       7:         83336        8577720  [C
                       8:         90525        2896800  java.lang.String
                       9:         14018        1675264  java.lang.Class
                      10:          9819        1579400  [Ljava.lang.Object;
                    Total        996089      500086120

                    The only other tools available are the commands mxdump and mx which allow access to MBean attributes and operations.

                    However, trying to run either of these resulted in a Null pointer exception. 

                    At this point I would generally download the code and start to poke about but by now I'd seen enough.

                    Conclusion

                    Although a nice idea it's very limited in what it offers. Under the covers it uses the Attach API so requires the JDK and not just the JRE in order to run so the majority of tools available are already provided with the standard JDK. There are a few additions to those tools but nothing that really makes it worthwhile using this instead.

                    The only tool I could see myself using would be the real-time GC data gathering tool but this would only be of use where GC logs were unavailable and no other monitoring tools were available.

                    The number of errors seen when running basic commands was also a concern, although this is just a project on github not a commercial offering and doesn't appear to be a particularly active project.

                    So, a useful tool to add to your diagnostic tool-kit? Not in my opinion. It's certainly an interesting idea and with further work could be useful but for now I'd stick with the tools that are already available.


                    Getting the most out of WLDF Part 1: What is the WLDF?

                    $
                    0
                    0
                    The WebLogic Diagnostic Framework (WLDF) is an often overlooked feature of WebLogic which can be very powerful when configured properly.

                    If it’s so great, then why aren’t more people using it?

                    I can’t give a firm answer to that, but I suspect that the answer is likely because WLDF is so large, so comprehensive, and so terrifying to the uninitiated! There are a lot of concepts to get your head round before you can make good use of it, such that people frequently don’t bother. After all, where do you start with something so big?

                    In this blog, I hope to remedy that feeling a little, by pointing out some of the low-hanging fruit so you can get to know enough of the basics that you’ll be able to make use of some of the features, while having enough of a knowledge of the framework to take things further yourself.


                    What can I get out of it?
                    WLDF, according to the documentation, lets you “create, collect, analyse, archive and access diagnostic data generated by a running server and the applications deployed within its containers.” 

                    To get all that functionality into WebLogic, Oracle has implemented lots of different components as part of the WLDF service including:
                    • Integration with JRockit Flight Recorder
                    • Diagnostic Image Capture
                      • a diagnostic snapshot for analysis of events
                    • Archiving
                      • event persistence
                    • Instrumentation
                      • diagnostic code which can be attached to applications or servers to track requests through the system
                    • Harvester
                      • captures metrics from runtime mbeans
                    • Watches
                      • monitors the server and applications
                    • Notifications
                      • works with watches to provide other ways to read the data when a watch is triggered
                    • Monitoring dashboard
                      • a configurable view of data about WebLogic servers and applications in graph form 
                    All of these are configurable either via the admin console or WLST.


                    Are we going to cover all of that?
                    Absolutely not! Each of those components has more detail on its own than would fit into a blog post, so I aim to give you enough of an overview to be able to go in depth in whichever component appeals to you the most.

                    Consider this handy diagram of how all the parts of WLDF fit together from the Oracle documentation:


                    Aside from the complexity, the first thing you’ll notice is how unclear that diagram is to anyone who does not already have an understanding of WLDF and how to actually use it.


                    Going further
                    As I touch on these topics, it would be worth keeping an eye on the documentation. I’ve already mentioned it a few times in this post alone and we haven’t started yet! Here’s a link to the contents page. I’ll be (very roughly) following the documentation, but at a higher level and with different examples (with screenshots!). I’ll include the code to configure it all with WLST, too, so you can follow along and do this for yourself in your development environment.

                    Our first topic? Very arbitrarily chosen: Watches

                    Check back next week!


                    | View Mike Croft's profile on LinkedIn | Mike CroftonGoogle+

                    MIDDLEWARE INSIGHT - C2B2 Newsletter Issue 15

                    $
                    0
                    0


                    MIDDLEWARE INSIGHT

                    At the Hub of the Middleware Industry


                    FEATURED NEWS


                    WildFly 8 is Now Available! - read more
                    Swiss Java Knife - A useful tool to add to your diagnostic tool-kit? - read more


                    JAVA / OPEN SOURCE

                    Java 8
                    Java 8 Launch Webcast, 25th of March, register here
                    JDK 8: General Availability, read the post by Mark Reinhold  
                    Java 8 is going live today - here's your crib sheet, read more on Jaxenter.com 
                    JAX Magazine goes Java 8 crazy this March, see the magazine here  


                    GlassFish
                    An Introduction to Connection Pools in Glassfish, read the post by Andy Overton 
                    GlassFish v4 Management, Automation and Monitoring by Adam Bien - watch the video here
                    Commercial GlassFish Support Is Back - read Adam Bien's Interview with Steve Millidge 
                    Writing and Deploying a Simple Web Application to GlassFish, read more here 
                     
                     
                    Other
                    Java EE 8 : What does the community want? Find out more 
                    Swiss Java Knife - A useful tool to add to your diagnostic tool-kit?, read more on the C2B2 Blog 
                    Apache httpd 2.2 and not so sticky sessions, read the post by Jaromir Hamala
                    Oh, you think Java sucks? How refreshing - read the article by Lucy Carey
                    Web Socket Implementation in Tomcat 7 and Jaggery, read more on Madhuka's blog
                    Abandon Fish! Migrating from GlassFish to JBoss or TomEE, read more by Simon Maple 
                    JPA 2.1 Entity Graphs, find out more on The Aquarium blog   

                    ORACLE

                    Getting the most out of WebLogic Diagnostic Framework Part 1: What is the WLDF? Read the article by Mike Croft
                    How to start multiple WebLogic managed servers, find out more on Zemian Blog  
                    Migrating from GlassFish to WebLogic: The Beauty of Java EE, read more on The Aquarium
                    How to create MySQL DataSource in WebLogic Server, read more here 
                    Common WebLogic Problems by Steve Millidge, read more on the WebLogic Community Blog
                    Deploying Jenkins to a WebLogic Server, read the article by Peter Lorenzen
                    C2B2 Wins the WebLogic Partner Community Award 2014, read more here 

                    JBOSS & RED HAT

                    WildFly 8
                    WildFly 8 is now available! read more on Arun Gupta's Blog
                    Wildfly 8.0.0.Final is Released, read an overview by Mark Addy 
                    WildFly 8.0 joins roster of certified Java EE7 apps, read more on Jaxenter.com 
                    WildFly 8 versus TomEE versus WebLogic, and other matters, read more on Jaxenter.com
                    Taking WildFly 8 for a test drive, read the article by Bernhard Lowenstein

                    Other

                    Red Hat drops "unique" business process management suite, read more on Jaxenter.com 
                    Handling Deployments When Provisioning JBoss domain.xml (With Ansible), read more on The Holy Java Blog
                    Red Hat officially announces release of JBoss BPM Suite 6 and JBoss BRMS 6, read more on Eric Schabell's Blog 
                    Red Hat JBoss BPM Suite - access GIT project using SSH, read more on Eric Schabell's Blog  
                    Infinispan Map/Reduce parallel execution, read more on the Infinispan Blog  
                    Fabric8, JBoss Fuse and Apache Karaf versions, read more on James Strachan's Blog  

                     DATA GRIDS

                    Hazelcast & Websockets, read more on the C2B2 Blog 
                    JBoss Data Grid Webinar Series - watch the videos here
                    Steve Millidge for JaxMagazine - Processing on the Grid, read more here  
                    GridGain Goes Open Source Under Apache v2.0, read more on DZone  

                    CONFERENCES & CALLS FOR PAPERS

                    Devoxx UK - 12 & 13 June 2014 - find out more and get your tickets here 
                    JAX London 2014, Call for Papers is now open until the 4th of April, find out more 
                    JavaOne, Call for Papers is now open until the 15th of April, find out more  
                    JavaZone, Call for Papers is now open until the 28th of April, find out more 

                    JBoss Data Grid: Installation and Development

                    $
                    0
                    0
                    In this blog, we will discuss one particular data grid platform from Redhat namely JBoss Data Grid (JDG). We will firstly cover how to access and install this data grid platform and then we will demonstrate how to develop and deploy a simple remote client/server data grid application which utilises the HotRod protocol. We will be using the latest release JDG 6.2 from Redhat in this article.

                    Installation Overview

                    To start using JDG, firstly log on to the redhat site https://access.redhat.com/home and download the software from the Downloads section of the site. We wish to download JDG 6.2 server by clicking on the appropriate links in the Downloads section. For future reference, it is also useful to download the quickstart and maven repository zip files. To install JDG, we simply unzip the JDG server package into an appropriate directory in your environment.


                    JDG Overview

                    In this section, we will provide a brief overview of the contents of the JDG installation package and the most notable configuration options available to users. Out of the box, users are provided with two runtime options either to run JDG in standalone or clustered mode. We can start JDG in either mode by invoking the stanadalone or clustered start up scripts in the <JDG_HOME>/ bin directory. To configure the JDG in either mode we need to configure the files standalone.xml and clustered.xml. In our case we will creating a distributed cache which will run on 3 node JDG cluster so we will be utilizing the clustered startup script.

                    In order to set up and add new cache instances to JDG, we modify the infinispan subsystems in the appropriate xml configuration file above. We should also note the principal difference between the standalone and clustered configuration file is that in the clustered configuration file there is a JGroups subsystem configured element which allows for communication and messaging between configured cache instances running in a JDG cluster.

                    Development Environment Setup and Configuration

                    In this section, we will detail how to develop and configure a simple datagrid application which will be deployed to a 3 node JDG cluster. We will demonstrate how to configure and deploy a distributed cache in JDG and also show how to develop a HotRod Java client application which will be used to insert, update and display entries in the distributed cache. We will firstly discuss setting a new distributed cache on a 3 node JDG cluster. In this example, we will run our JDG cluster on a single machine by running each JDG instance on different ports.

                    Firstly, we will create 3 instances of JDG by creating 3 directories (server1, server2, server3) on our host machine and unzipping each JDG installation into each directory.


                    We will now configure each node in our cluster by copy and renaming the clustered.xml configuration file in the <JDG_HOME>\server1\jboss-datagrid-6.2.0-server\standalone\configuration directory. We will name each of the cluster configuration files as "clustered1.xml", "clustered2.xml" and "clustered3.xml" for the JDG instances denoted by "server1", "server2" and "server3" respectively. We will now set up a new distributed cache on our JDG cluster by modifying the infinispan subsystem element in each clustered<n>.xml file. We will demonstrate this for the node denoted "server1" here by modifying the file "clustered1.xml". The cache configuration shown here will be the same across all 3 nodes.

                    To setup a new distributed cache named "directory-dist-cache", we configure the following elements in the file named "clustered1.xml".

                    <subsystem xmlns="urn:infinispan:server:endpoint:6.0">
                            <hotrod-connector socket-binding="hotrod" cache-container="clusteredcache">
                             <topology-state-transfer lazy-retrieval="false" lock-timeout="1000" replication-timeout="5000"/>
                            </hotrod-connector>
                            .........
                          <subsystem xmlns="urn:infinispan:server:core:6.0" default-cache-container="clusteredcache">
                                       <cache-container name="clusteredcache" default-cache="default" statistics="true">
                                           <transport executor="infinispan-transport" lock-timeout="60000"/>
                                        ......
                                   <distributed-cache name="directory-dist-cache" mode="SYNC" owners="2" remote-                   timeout="30000" start="EAGER">
                                  <locking isolation="READ_COMMITTED" acquire-timeout="30000" striping="false"/>
                                  <eviction strategy="LRU" max-entries="20" />
                                  <transaction mode="NONE"/>
                                  </distributed-cache>
                                 ..............
                      </cache-container>
                         

                    </subsystem>

                     <socket-binding-group name="standard-sockets" default-interface="public" port-offset="${jboss.socket.binding.port-offset:0}">
                    ......
                    <socket-binding name="hotrod" interface="management" port="11222"/>
                    ......
                    /socket-binding-group>

                    </server>


                    We will discuss they key elements and attributes relating to the configuration above.

                    • In the infinispan endpoint subsystem, we will configure hotrod client's to connect to the JDG server instance on socket 11222. 
                    • The name of the cache container to host each of the cache instances will be held in the container named "clusteredcache".
                    • We have configured the infinispan core subsystem to the default cache container named "clusteredcacahe" whereby we will allow for jmx statistics to be collected relating the configured cache entries i.e statistics="true"
                    • We have created a new distributed cache named "directory-dist-cache" whereby there will be two copies of each cache entry held on two of the 3 cluster nodes. 
                    • We have also set up an eviction policy whereby should there be more than 20 entries in our cache then cache entries will be removed using the LRU algorithm
                    • We should have configured nodes "server2" and "server3" to start up with a port offset of 100 and 200 respectively by configuring the socketing binding group element appropriately. Please view the socket bindings noted below.

                    To set the socket binding element with a port offset of 100 on "server2", we configure "clustered2.xml" with the following entry:

                    <socket-binding-group name="standard-sockets" default-interface="public" port-offset="${jboss.socket.binding.port-offset:100}">
                    ......
                    <socket-binding name="hotrod" interface="management" port="11222"/>
                    ......
                    /socket-binding-group>


                    To set the socket binding element with a port offset of 200 on "server3", we configure "clustered3.xml" with the following entry:

                    <socket-binding-group name="standard-sockets" default-interface="public" port-offset="${jboss.socket.binding.port-offset:200}">
                    ......
                    <socket-binding name="hotrod" interface="management" port="11222"/>
                    ......
                    /socket-binding-group>

                    Before discussing the setup and configuration of our Hotrod client which will be used to interact with our JDG clustered HotRod server, we will start up each server instance to ensure our newly configured JDG distributed cache starts up correctly.

                    Open up 3 console Windows or Linux and execute the following start up commands:

                    Console 1:

                    1) Navigate to <JDG_HOME>\server1\jboss-datagrid-6.2.0-server\bin

                    2) Execute this command to start the first instance of our JDG cluster denoted "server1": clustered -c=clustered1.xml -Djboss.node.name=server1

                    Console 2:

                    1) Navigate to <JDG_HOME>\server2\jboss-datagrid-6.2.0-server\bin

                    2) Execute this command to start the second instance of our JDG cluster denoted "server2": clustered -c=clustered2.xml -Djboss.node.name=server2

                    Console 3:

                    1) Navigate to <JDG_HOME>\server3\jboss-datagrid-6.2.0-server\bin

                    2) Execute this command to start the third instance of our JDG cluster denoted "server3": clustered -c=clustered3.xml -Djboss.node.name=server3

                    Providing all 3 JDG instances have started up correctly, you should see output in the console window whereby we can see there are 3 JDG instances in the JGroups view:


                    HotRod Client Development Setup

                    Now that the Hotrod server is up and running, we now need to develop a Hotrod Java client which will interact with the clustered server application. The development environment consists of the following tools.

                    1) JDK Hotspot 1.7.0_45
                    2) IDE - Eclipse Kepler Build id:  20130919-0819

                    The HotRod client application is a simple application consisting of two Java classes. The application allows users to retrieve a reference to the distributed cache from the JDG server and then perform these actions:

                    a) add new cinema objects.
                    b) add and remove shows to each cinema object.
                    c) print the list of all cinemas and shows stored in our distributed cache.

                    The source code can be downloaded from github @ https://github.com/davewinters/JDG. We could use maven here to build and execute our application by configuring the maven settings.xml to point to the maven repository files we downloaded earlier and set up a maven project file (pom.xml) to build and execute the client application.

                    In this article we will build our application using the Eclipse IDE and run the client application on the command line. To create a HotRod client application and execute the sample application, one should complete the following steps:

                    1) Create a new Java Project in Eclipse
                    2) Create a new package named uk.co.c2b2.jdg.hotrod and import the source code that has been downloaded from Github mentioned previously.
                    3) Now we need to configure the build path in Eclipse to the appropriate JDG client jar files which are required to compile  application. You should include all the client jar files in the project build path. These jar files are contained in the JDG installation zip file. For example on my machine these jar files are located in the directory: <JDG_HOME>\server1\jboss-datagrid-6.2.0-server\client\hotrod\java
                    4. Providing the Eclipse build path has been configured appropriately, the application source should compile without issue.
                    5. We will need to execute the Hotrod application by opening the console window and executing the following command. Note the path specified here will differ depending on where the JDG client jar files and application class files are located in your environment:

                    java -classpath ".;C:\Users\David\Installs\jbossdatagrids62\server1\jboss-datagrid-6.2.0-server\client\hotrod\java\commons-pool-1.6-redhat-4.jar;C:\Users\David\Installs\jbossdatagrids62\server1\jboss-datagrid-6.2.0-server\client\hotrod\java\infinispan-client-hotrod-6.0.1.Final-redhat-2.jar;C:\Users\David\Installs\jbossdatagrids62\server1\jboss-datagrid-6.2.0-server\client\hotrod\java\infinispan-commons-6.0.1.Final-redhat-2.jar;C:\Users\David\Installs\jbossdatagrids62\server1\jboss-datagrid-6.2.0-server\client\hotrod\java\infinispan-query-dsl-6.0.1.Final-redhat-2.jar;C:\Users\David\Installs\jbossdatagrids62\server1\jboss-datagrid-6.2.0-server\client\hotrod\java\infinispan-remote-query-client-6.0.1.Final-redhat-2.jar;C:\Users\David\Installs\jbossdatagrids62\server1\jboss-datagrid-6.2.0-server\client\hotrod\java\jboss-logging-3.1.2.GA-redhat-1.jar;C:\Users\David\Installs\jbossdatagrids62\server1\jboss-datagrid-6.2.0-server\client\hotrod\java\jboss-marshalling-1.4.2.Final-redhat-2.jar;C:\Users\David\Installs\jbossdatagrids62\server1\jboss-datagrid-6.2.0-server\client\hotrod\java\jboss-marshalling-river-1.4.2.Final-redhat-2.jar;C:\Users\David\Installs\jbossdatagrids62\server1\jboss-datagrid-6.2.0-server\client\hotrod\java\protobuf-java-2.5.0.jar;C:\Users\David\Installs\jbossdatagrids62\server1\jboss-datagrid-6.2.0-server\client\hotrod\java\protostream-1.0.0.CR1-redhat-1.jar" uk/co/c2b2/jdg/hotrod/CinemaDirectory

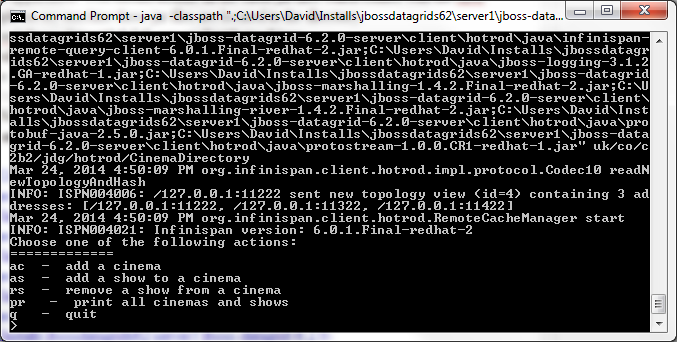
                    6. The Hotrod client at runtime provides the end user with a number of different options to interact with the distributed cache as we can view from the console window below.


                    Client Application Principal API Details

                    We will not provide a detailed overview of the Hotrod application code however we will describe solely the principal API and code details briefly.

                    In order to interact with the distributed cache on the JDG cluster using the Hotrod protocol, we will use the RemoteCacheManager Object which will allow us to retrieve a remote reference to the distributed cache. We have initialised a Properties object with the list of JDG instances and the associated with HotRod server port on each instance. We can add Cinema objects into the distributed cache using the RemoteCache.put() method.

                     private RemoteCacheManager cacheManager;
                     private RemoteCache<String, Object> cache;
                    .....
                    Properties properties = new Properties();
                     properties.setProperty(ConfigurationProperties.SERVER_LIST, "127.0.0.1:11222;127.0.0.1:11322;127.0.0.1:11422");
                    cacheManager = new RemoteCacheManager(properties);
                    cache = cacheManager.getCache("directory-dist-cache");
                    .....
                    cache.put(cinemaKey, cinemalist);

                    For further details on JDG please visit: http://www.redhat.com/products/jbossenterprisemiddleware/data-grid/

                    Webinar: Introduction to JBoss Data Grid -- Installation, Configuration and Development


                    In this webinar we will look at the basics of setting up JBoss Data Grid covering installation, configuration and development. We will look at practical examples of storing data, viewing the data in the cache and removing it. We will also take a look at the different clustered modes and what effect these have on the storage of your data:


                    JBoss Data Grid: Monitoring using JON

                    $
                    0
                    0
                    Overview

                    There are multiple ways and tools which we can use to monitor JDG including using the JDG Listener API when cache entries are removed and added to specific cachess, exposing the jmx cache statistics however we will focus on using the JBoss Operations Network (JON) to monitor JDG. We will use JON 3.2 and JDG 6.2 in this article. We will use |JON to monitor the distributed Hotrod cache which was deployed to a JDG cluster. The details to set up a JDG cluster which hosts a distributed cache instance can be found here. We will discuss firstly how to setup JON to monitor JDG using the relevant plugins and then demonstrate some of the monitoring capabilities within JON. In this blog, we will use the acronyms RHQ and JON interchangeability as JON is the supported version of RHQ which is open-source.

                    JON Installation and Configuration

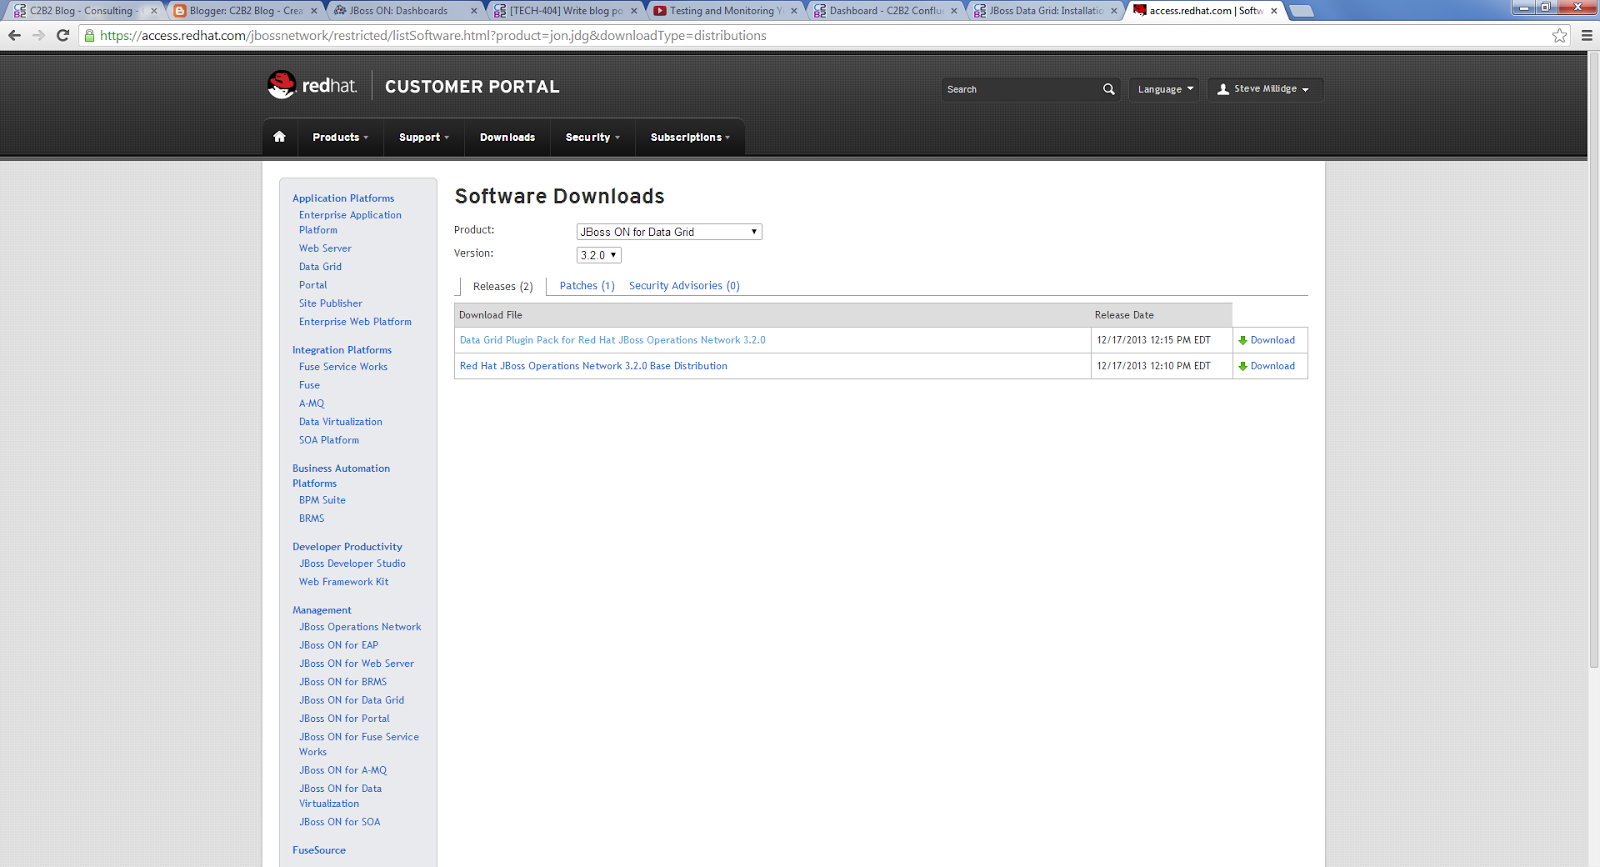
                    Before installing JON, we need to firstly download JON 3.2 from the Redhat site along with the relevant JON plugins for JDG. We should select "Red Hat JBoss Operations Network 3.2.0 Base Distribution" and the plugin packs to allow for JON to monitor the  JDG cluster. The plugin pack names are: "Data Grid Plugin Pack for Red Hat JBoss Operations Network 3.2.0" and "Application Platform Plugin Pack for Red Hat JBoss Operations Network 3.2.0"


                    Now that we have downloaded the JON installation package, there are a number of steps which we need to follow to configure JON. JON 3.2 supports Oracle and PostgreSQL as a database backend. We will be using Oracle XE 11.2 to host the RHQ schema objects created at installation time. Furthermore, we have installed JON 3.2 on a single host machine using JDK1.7.0_45. For a list of supported configurations please view this page: https://access.redhat.com/site/articles/112523

                    We followed these steps to setup and configure JON:

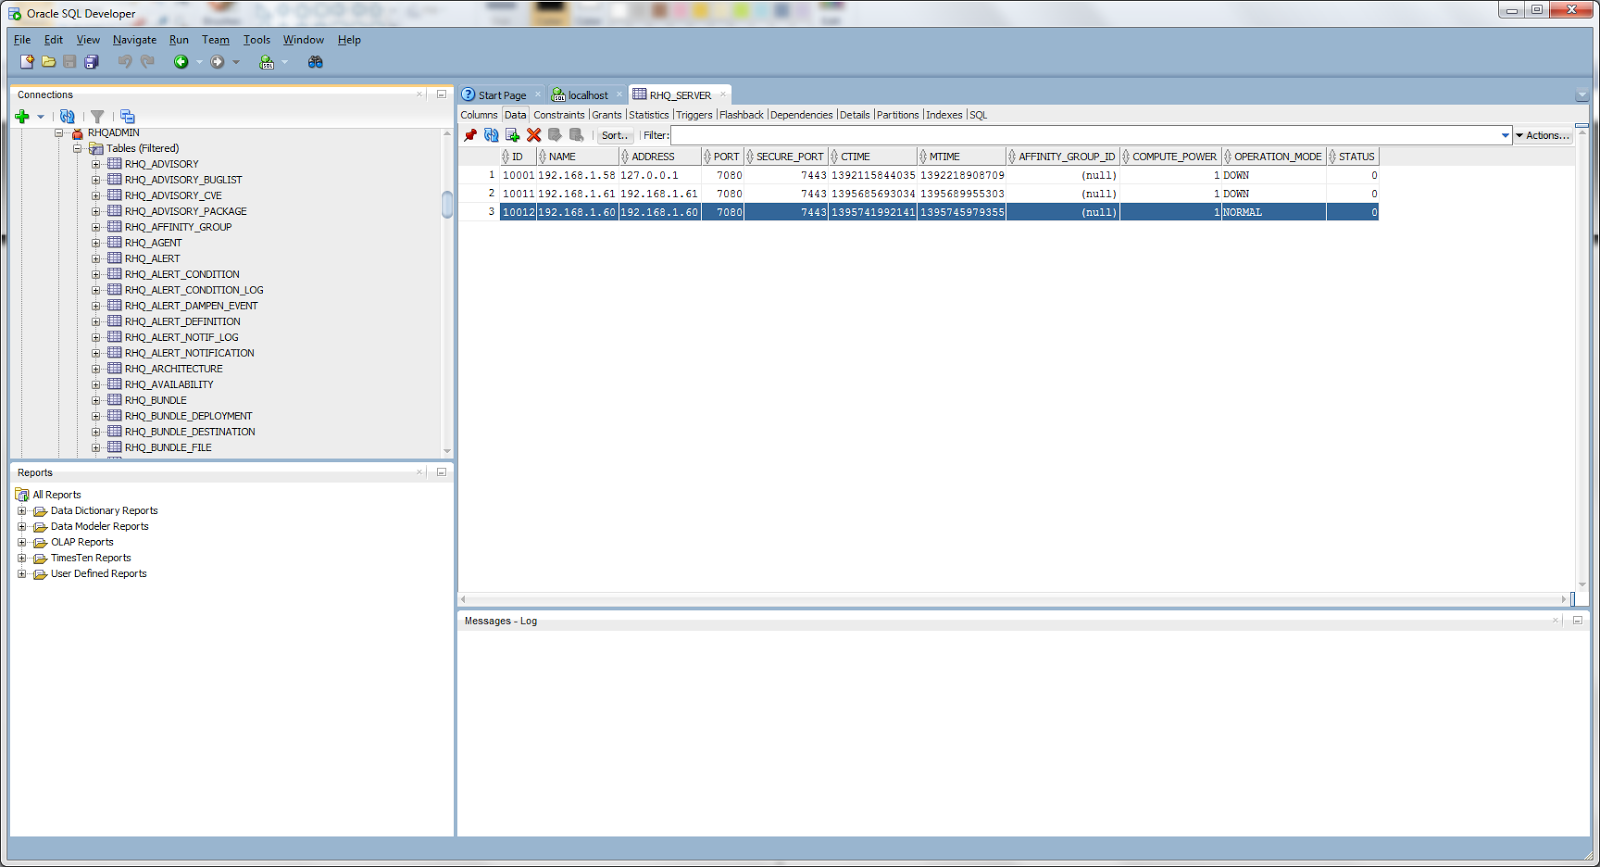
                    1) Before running the JON installer scripts, we need to setup a user/schema in the Oracle database which will be used to store JON server configuration details and metrics data. I have set up a user named "RHQADMIN" for this purpose.


                    2) Unzip the JON installation package we downloaded earlier and configure the JON server properties file named rhq-server.properties located in the <JON_HOME>\bin directory before running the installation script.
                    3) There are a few notable sections which need to configure in the rhq-server.properties file to configure JON to run on a specific machine and against the Oracle database we preconfigured in step 2 above. These sections are noted below.

                    a) Provide the name of the database server name, port, database name, username and password where the RHQ schema objects will be hosted. You should provide the encoded user password for the "rhq.server.database.password" property. This is generated using the rhq-encode script located in the <RHQ_SERVER_HOME>/bin directory. For example, below are the configuration details for Oracle XE 11.2.

                    rhq.server.database.connection-url=jdbc:oracle:thin:@<db_hostname>:1521:xe
                    rhq.server.database.user-name=rhqadmin
                    rhq.server.database.password=xxxxxx
                    rhq.server.database.type-mapping=Oracle11g
                    rhq.server.database.server-name=unused
                    rhq.server.database.port=unused
                    rhq.server.database.db-name=unused
                    hibernate.dialect=org.hibernate.dialect.Oracle10gDialect
                    rhq.server.quartz.driverDelegateClass=org.quartz.impl.jdbcjobstore.oracle.OracleDelegate

                    b) Configure the properties "jboss.bind.address" and "jboss.bind.address.management" to the ip address or hostname were the server will be installed.

                    c) Configure these 5 installer properties appropriately were the properties "rhq.autoinstall.enabled" and "rhq.autoinstall.database" should be set to "true" and "auto" respectively :

                    rhq.autoinstall.enabled=true
                    rhq.autoinstall.database=auto
                    rhq.autoinstall.public-endpoint-address=<server_ip_address>
                    rhq.server.management.password=xxxxxx
                    rhq.storage.nodes=<server_hostname>

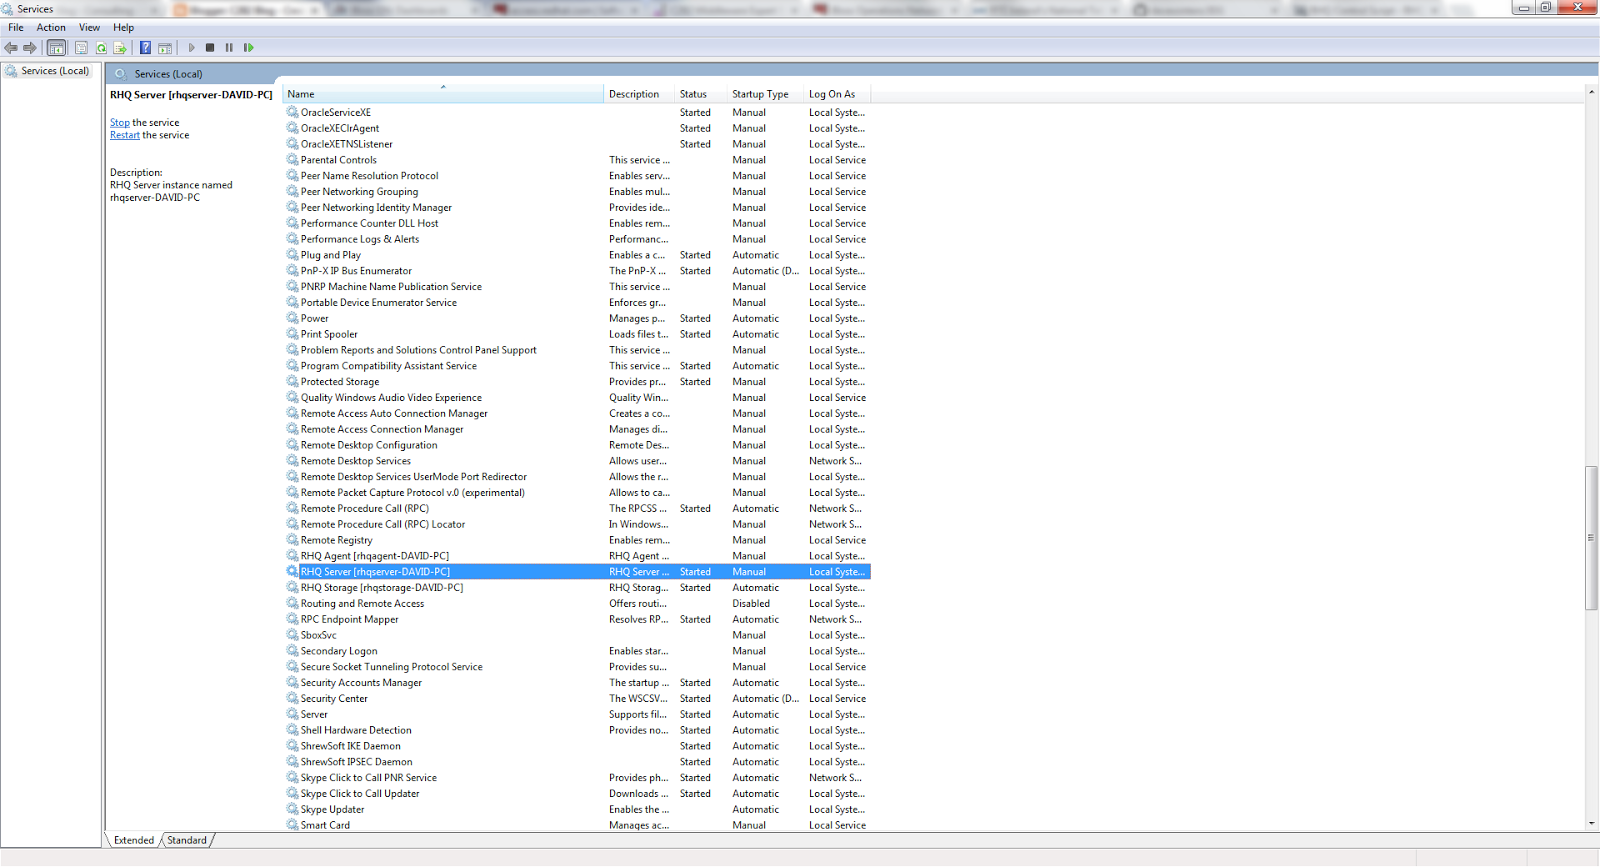
                    Now that we have configured the rhq-server.properties file, we now need to install the rhq-server, rhq-storage server and rhq-agent. I have installed all 3 on my local windows machine and since I am installing on windows these will be installed as services. To install the 3 JON/RHQ components above, we use the 'rhqctl' command. Execute the command rhqctl install from the console window which will install by default the 3 JON components aforementioned. The installer should take some minutes to install. Once the RHQ Server, storage engine and agent has been installed, we now can start these services using windows services explorer and navigate to http://<server-name>:7080 in the browser window. We should note I have only chosen to start the rhq storage and rhq server service as before we can start the rhq-agent, we firstly need to configure agent which we will discuss in the next section.


                    JON Agent/Plugin Configuration and JDG Instance Detection

                    The 3 node JDG cluster which we had set up previously referenced here runs on the same machine as the JDG server and the agent which we will now configure. The role of the RHQ agent is to send monitoring updates to the RHQ Server which can be then viewed in the RHQ dashboard console. We need to firstly configure the RHQ agent to the correct RHQ server and also provide the agent with the correct plugin packages to allow for this. The following steps should be completed to achieve this:

                    1) Open up a console window and navigate to the "bin" directory were RHQ has been installed and execute the batch script rhq-agent. The first time this command is run, the user is prompted for the agent name, agent hostname, server hostname and port. If you need to re-configure the agent at any time execute rhq-agent --fullcleanconfig. Providing the configuration details are correct, the agent should be registered with the RHQ server successfully.

                    2) The next step to configure the agent is to install the relevant plugins to allow the RHQ server to monitor the running JDG instances via the RHQ agent. We need to install the two plugin packs which we downloaded earlier. We will install these using the RHQ server console however you can also deploy them directly into the RHQ Server plugins directory located at <RHQ_SERVER_HOME>/plugins.

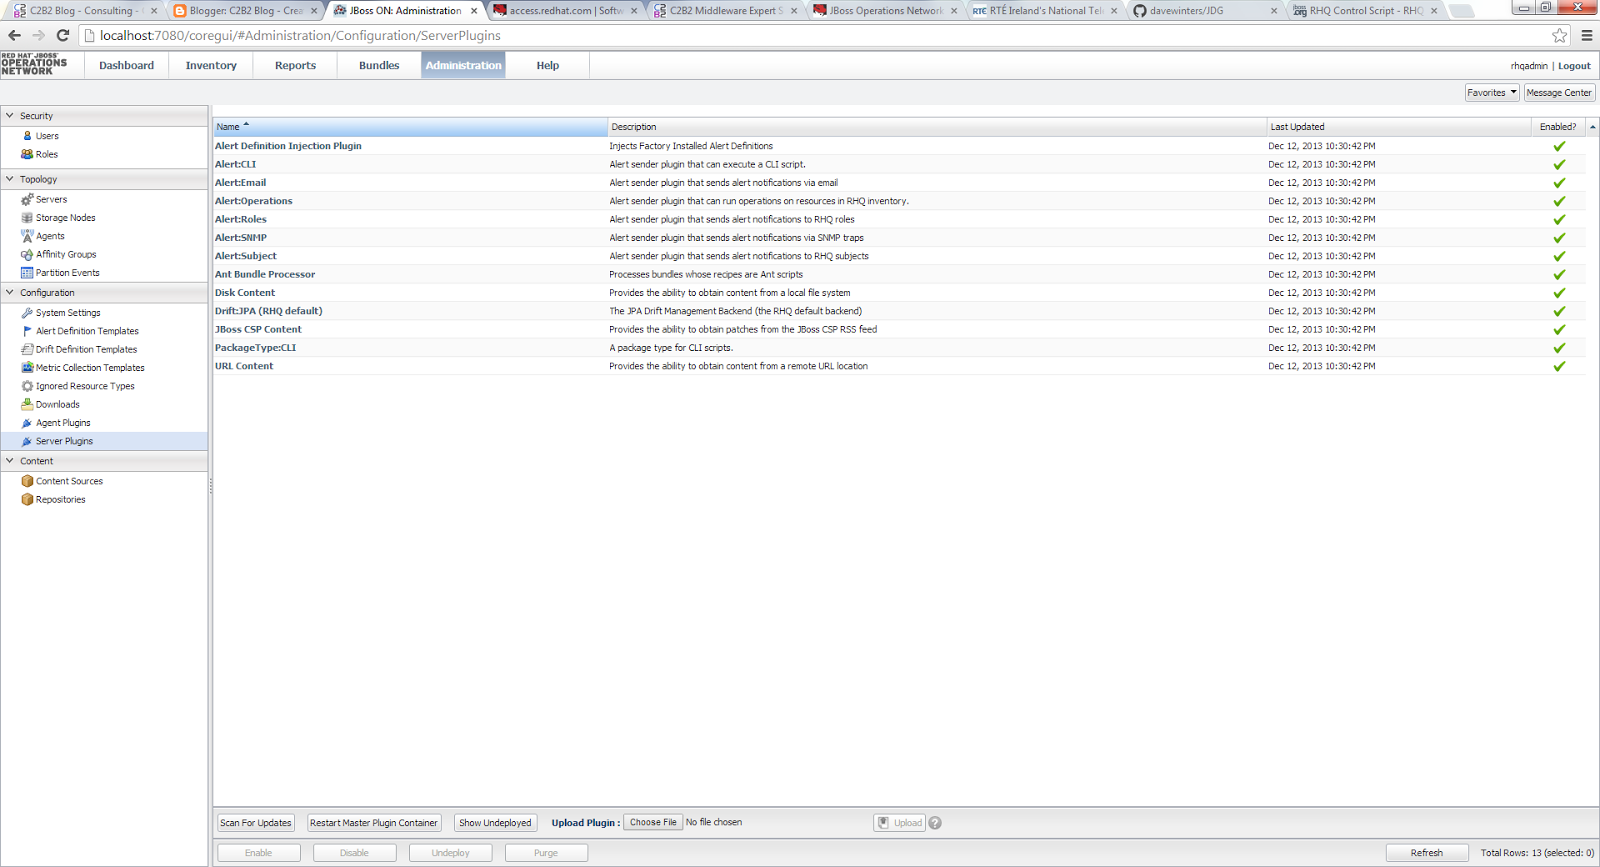
                    3) To install the two plugins previously mentioned, unzip the two plugin installer zip files into a directory on your file system. Navigate to the "Administration" tab in the RHQ server web console, click on the "server plugin"s menu option and now click on the "choose file" button beside the upload plugin label in this screen. The two plugins have been uploaded to the server and we now want for these plugins to be downloaded to the RHQ agent which can be achieved by either restarting the rhq-agent or by clicking on the "Agent Plugins" menu option and then by pressing the "scan for updates" button which should trigger the copying of the JDG plugins over to the agent "plugins" directory. Providing the agent has been updated with the two previously uploaded plugins, these should be visible in your <RHQ_AGENT_HOME>/plugins directory like in the screenshot below.


                    RHQ Server JDG Resource Configuration and Monitoring Setup

                    Now that the RHQ server, agent and JDG plugins have bee installed, the last part to setup monitoring of the cache instances running on the JDG cluster is to configure the RHQ Server using the RHQ server web console to indicate what JDG servers we wish to monitor and what monitoring metrics we wish to gather on the distributed cache instance.

                    To allow the server to detect and monitor the JDG instances, we need to complete the following steps:

                    1) Start up all JDG instances which we wish to monitor and now navigate to the "Inventory" tab and then click on the menu option named "Discovery Queue" in the RHQ server web console. You should now view the 3 running JDG instances which should be selected before clicking on the "Import" button at the bottom of the screen to import these resources into the RHQ Server configuration for monitoring.

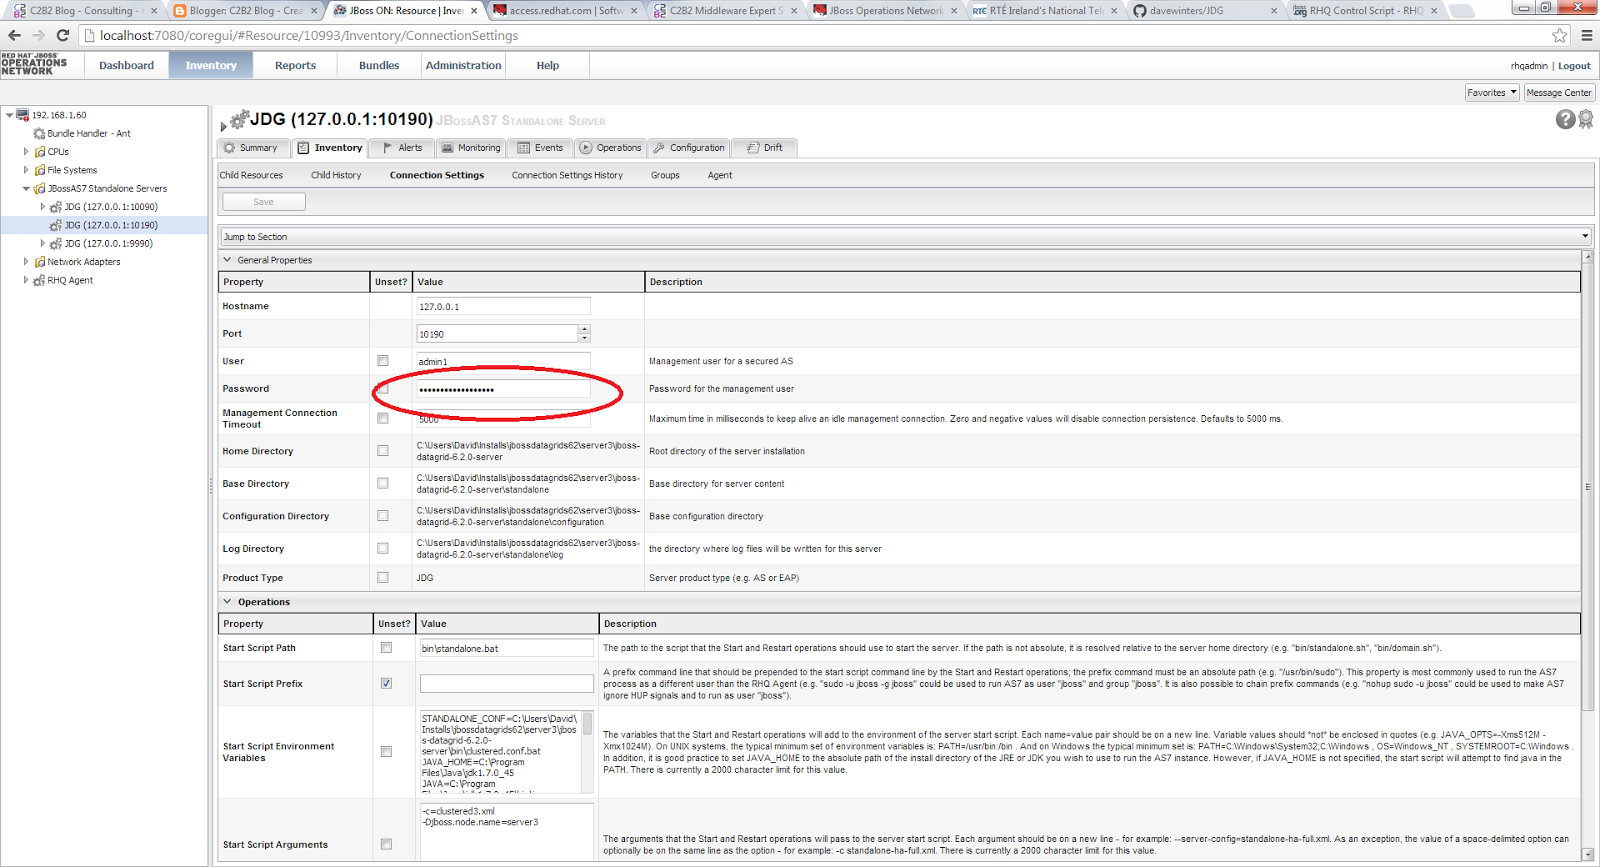
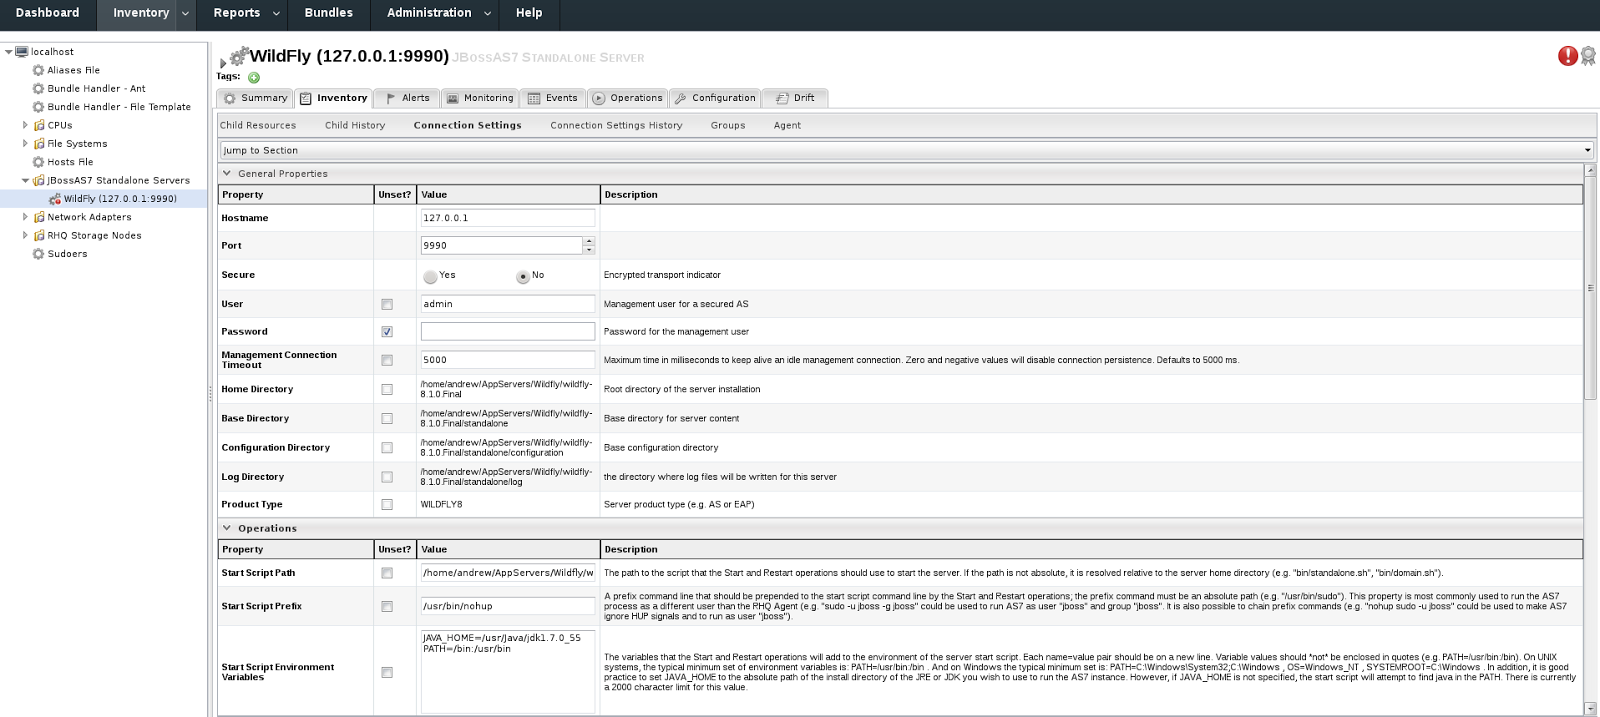
                    2) Now click the "Servers" menu option in the "Inventory" window and you should be able to view the newly imported JDG instances. We now need to enter the password details for a user configured under management realm for each JDG instance. To set the password, click on each JDG instance then the"Connection Settings" tab.


                    Providing there are no issues with the RHQ server and agent configuration details, the server should be marked as available in the "Child Resources" screen under the "Inventory" tab( A Green Tick should be visible under the Availability Column).

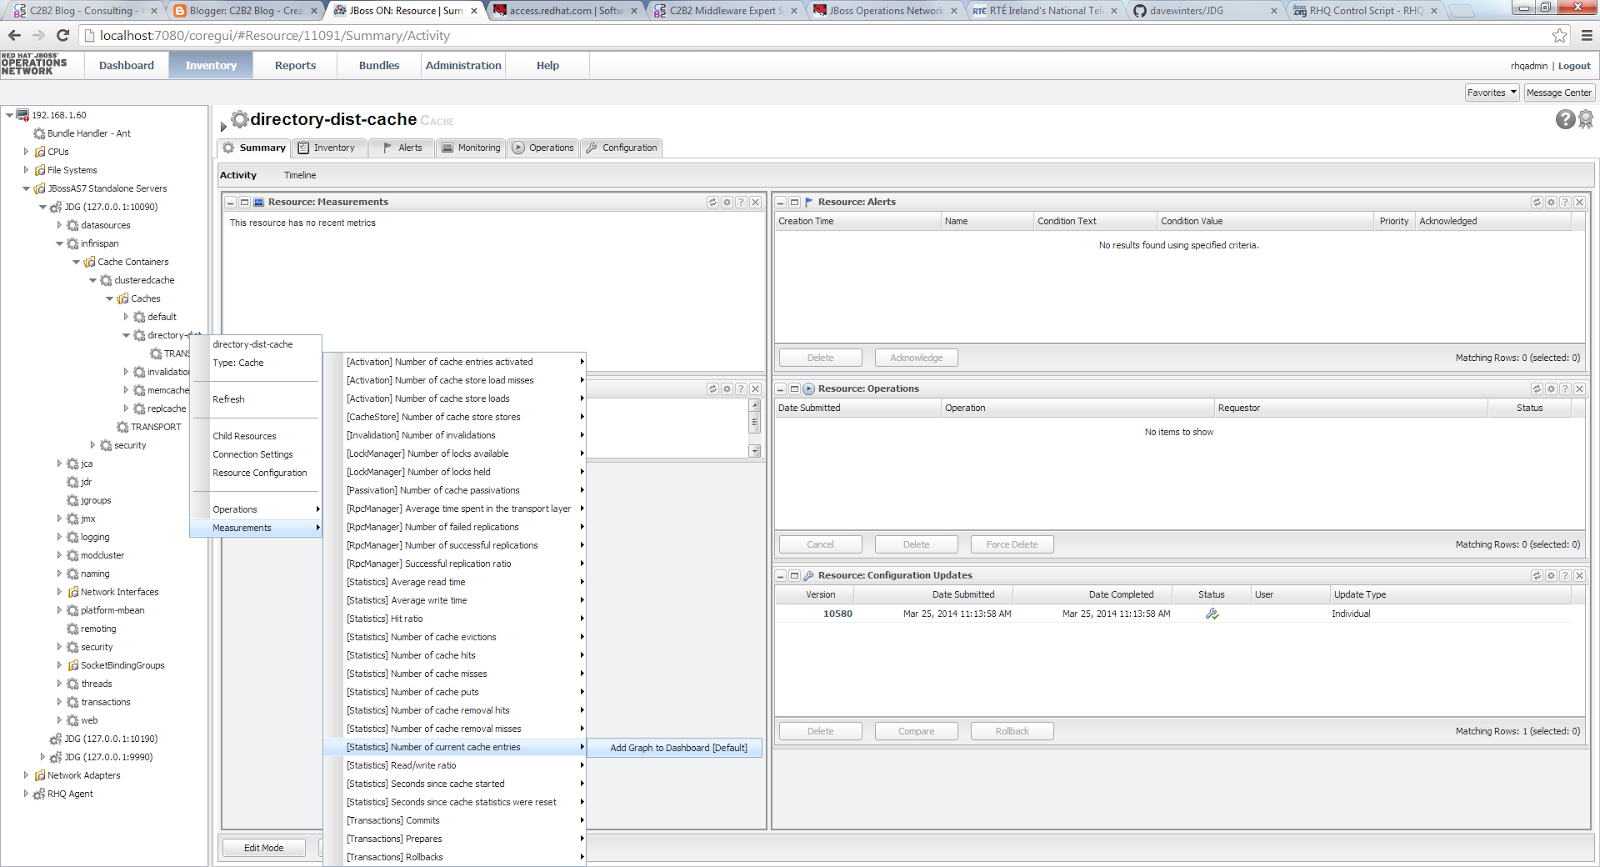
                    The last part will be to specify what metrics we wish to monitor and to view on either your own dashbaord or just to add to the default dashboard in the RHQ server console. To add new monitoring metrics to the RHQ server dashboard, click on the JDG instance, navigate to the "Child Resources" window, click on the "infinispan" resource and navigate to the cache instance we wish to monitor on the JDG instance. We wish to monitor the distributed cache named "directory-dist-cache" to our JDG cluster as mentioned in the previous blog . Now right click on the cache name and select the "Measurements" dropdown option and we are now presented with a number of cache metrics which we can choose from. We can view an example of various metrics available based on the screenshot below. We are provided with the option here to add these metrics to the default or to are own custom dashboard.


                    Getting the most out of WLDF Part 2: Watches

                    $
                    0
                    0
                    Read Part 1: What is the WLDF? here

                    In this post, I'll be looking at using watches in WLDF.

                    What is a watch?
                    A watch, at its most basic, is simply a way to monitor one of three things:
                    • MBeans
                    • A server log
                    • Instrumentation (event) data
                    To configure an instrumentation watch, you first need to know what instrumentation is, and how to instrument applications or servers, so we’ll put that to one side for now.

                    A server log watch is exactly that – a watch to monitor the server log for anything you want! For example, all Critical severity log entries, entries which mention a particular server or particular log message IDs.

                    An MBean watch relies on the Harvester to collect server runtime MBean metrics which does not need to be configured separately for your watch to work, but do bear in mind that the data gathered will not be archived unless you configure the Harvester properly:

                    Note:
                    If you define a watch rule to monitor an MBean (or MBean attributes) that the Harvester is not configured to harvest, the watch will work. The Harvester will "implicitly" harvest values to satisfy the requirements set in the defined watch rules. However, data harvested in this way (that is, implicitly for a watch) will not be archived. See Chapter 7, "Configuring the Harvester for Metric Collection," for more information about the Harvester.

                    How do I make a watch?
                    I’ve already mentioned that Instrumentation watches require a little understanding of instrumentation first, so I won’t cover them here. If you’re already familiar with instrumentation, then configuring watches for your instrumented applications isn’t too tricky.


                    Step 1: Create a Diagnostic Module
                    The first step in creating watches is always the same. In the Domain Structure pane, select “Diagnostic Modules” under the “Diagnostics” entry. 

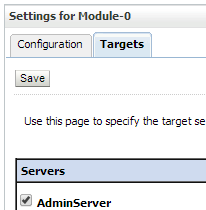
                    Select a diagnostic module if you’ve created one, or create a new one if not. Since creating a new module only requires you to name it (and provide an optional description), you’ll need to configure it once you’ve created it. The most important thing to do is to target it to the server you want to monitor.


                    Step 2: Create a Watch
                    Once the module is targeted, click the configuration tab, then “Watches and Notifications”. In the lower pane, click the “New” button to create a new watch and choose whether it should be a Server Log or Collected Metric watch (making sure that the “Enable Watch” checkbox is checked) then click “Next”


                    Step 3: Define the Rule Expressions
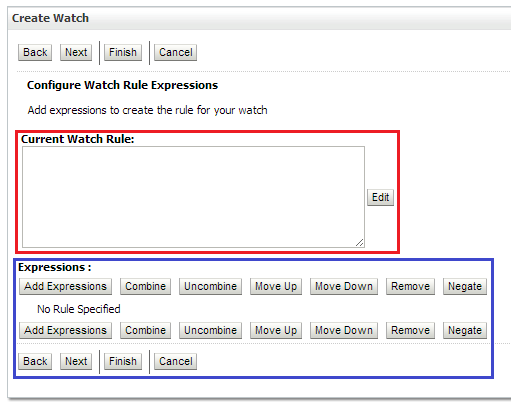
                    You should now be presented with the following screen to create your watch rule expressions:


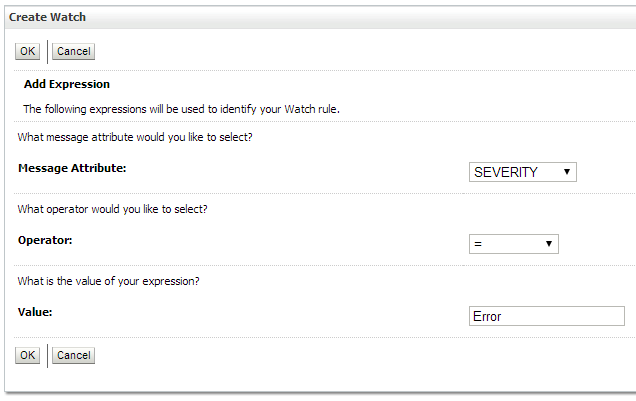
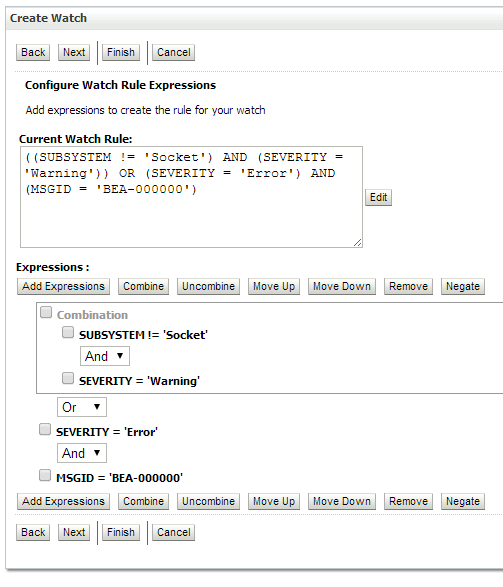
                    There are two ways to build rule expressions. Highlighted in red is a large text box which you will find is not editable. Clicking the “Edit” button will take you to a page where you can directly edit the rule as text. If you’re not familiar with WLDF query language rules, that might not seem like the most helpful feature but when you consider that it allows you to create a rule expression and copy the text for future reuse, the value becomes clear.

                    Highlighted in blue is the expression builder. Clicking “Add Expressions” will take you to a page where you can construct individual expressions. The most useful part of this feature is that it gives dropdown lists for the available attributes and operators:


                    The expression builder can also be used to arrange these expressions in a complex, but helpfully visual way, as shown below in an example server log watch:

                    Step 4: Configure an alarm
                    An alarm can be manually or automatically reset. If manually reset then the alarm will fire once and be disabled until there is manual intervention to reset it. Automatically resetting alarms will reset after a period of time (specified in seconds. This value will be the maximum frequency of the alarm triggering. For example, if an event happens regularly every 10 seconds and an alarm is configured to reset every 11 seconds, then we will get this scenario:
                    • The alarm is active and the event occurs, triggering and disabling the alarm.
                    • 10s later, the event happens again, but the alarm is still disabled.
                    • 1s later, the alarm is reset
                    • 9s later, the event happens again and this time, the alarm is not disabled, so triggers again.
                    This scenario is a little contrived, but it shows that setting the reset period to 11 seconds does not mean that the alarm will fire every 11 seconds, as in this case where it fired with a 20 second gap.


                    Step 5: Configure watch notifications
                    If you have already configured a notification, you can add it here. If not, just click save. We won’t cover notifications in this post, but they can always be added retrospectively to any watch.


                    Using the WLDF Query Language
                    We’ve actually already touched on the WLDF query language when we covered rule expressions. The example above shows how you can add expressions very easily to build complex rules for log watches so I won’t go over that again, other than to point out the WLDF Query Language reference page which contains a table showing all possible variables for log messages: http://docs.oracle.com/cd/E17904_01/web.1111/e13714/appendix_query.htm#g1062247

                    MBean watches are a little more complex, however, although they can still be constructed with a step-by-step interface in the admin console or written as text. Either way, there are a huge number of possible MBeans to monitor; each with their own list of attributes which need to be specified in expressions. The full MBean reference, including attributes, is documented here: http://docs.oracle.com/cd/E12839_01/apirefs.1111/e13951/core/index.html 

                    Browsing the “Runtime MBeans” topic in the list shows a number of available MBeans, one of which is the ServerRuntimeMBean, which has an attribute called OpenSocketsCurrentCount. I’ll show how to create an MBean watch expression which uses this attribute using the graphical interface.


                    Step 1
                    As in the log example, the first thing to do is to create a diagnostic module, if one does not already exist, and to create a new watch, choosing to create a Collected Metricwatch. Once the watch is created, configure it as before and click “Add Expressions” on the Rule Expressions tab as before:


                    As you can see, I have already configured one expression to watch the number of currently open sessions. There are a few different parts to this rule, which apply to any MBean watch rule. The first three parts (red, blue and green) are enclosed in a dollar and parentheses ( ${…} ) because they contain special characters. The red part is the name of the server which holds the instance of the MBean to be queried. On my development server, I only have an AdminServer instance. Next, in blue, is the “type” which refers to the MBean to look up on the server. The green part, separated by a double forward-stroke, is the attribute name of the MBean. Finally, in orange, is the rule itself to apply to that MBean attribute.

                    Some of you reading this blog post might have already guessed exactly what the open sockets rule is going to look like: (${com.bea:Name=AdminServer,Type= ServerRuntime // OpenSocketsCurrentCount } >= 1). I’ll still show the graphical steps to how to get to that point, since it demonstrates how the GUI can be used effectively.


                    Step 2
                    After clicking “Add Expression”, you’ll need to choose whether you want to query the Domain Runtime, or the Server Runtime. We want to look at a value which is specific to a server instance, so choose Server Runtime and click “Next”. You will be presented with a dropdown box of available MBeans. The WebLogic MBean reference I linked to earlier shows all weblogic.management.runtime.* MBeans, so choose the ServerRuntimeMBean as shown:


                    Step 3
                    Clicking “Next” will allow you to choose the MBean instance on the correct server:


                    Step 4
                    Finally, we can select the MBean attribute and choose the operator and value to evaluate by:


                    Clicking Finish will show our completed WLDF expression:


                    Going Further
                    On my test server, I create two watches: one Server Log watch and one Collected Metrics watch. Both are monitoring sockets, the first monitoring the logs for any socket errors and the second monitoring the OpenSocketsCurrentCount attribute of the ServerRuntimeMBean and alerting when there is more than one socket open.

                    Below is the output from the watches as I have configured them:

                     ####<26-Mar-2014 11:17:30 o'clock GMT> <Notice> <Diagnostics> <Mike-PC> <AdminServer> <[ACTIVE] ExecuteThread: '4' for queue: 'weblogic.kernel.Default (self-tuning)'> <<WLS Kernel>> <> <> <1395832650884> <BEA-320068> <Watch 'SocketsOpen' with severity 'Notice' on server 'AdminServer' has triggered at 26-Mar-2014 11:17:30 o'clock GMT. Notification details:   
                    WatchRuleType: Harvester
                    WatchRule: ${com.bea:Name=AdminServer,Type=ServerRuntime//OpenSocketsCurrentCount} >=1
                    WatchData: com.bea:Name=AdminServer,Type=ServerRuntime//OpenSocketsCurrentCount = 2
                    WatchAlarmType: AutomaticReset
                    WatchAlarmResetPeriod: 10000
                    >
                    ####<26-Mar-2014 11:17:39 o'clock GMT> <Error> <Socket> <Mike-PC> <AdminServer> <[ACTIVE] ExecuteThread: '3' for queue: 'weblogic.kernel.Default (self-tuning)'> <<WLS Kernel>> <> <> <1395832659211> <BEA-000403> <IOException occurred on socket: Socket[addr=/127.0.0.1,port=58139,localport=7001]
                    java.net.SocketException: recv failed: Descriptor not a socket.
                    java.net.SocketException: recv failed: Descriptor not a socket
                    at jrockit.net.SocketNativeIO.readBytesPinned(Native Method)
                    at jrockit.net.SocketNativeIO.socketRead(SocketNativeIO.java:32)
                    at java.net.SocketInputStream.socketRead0(SocketInputStream.java)
                    at java.net.SocketInputStream.read(SocketInputStream.java:129)
                    at weblogic.socket.SocketMuxer.readFromSocket(SocketMuxer.java:980)
                    at weblogic.socket.SocketMuxer.readReadySocketOnce(SocketMuxer.java:922)
                    at weblogic.socket.SocketMuxer.readReadySocket(SocketMuxer.java:888)
                    at weblogic.socket.JavaSocketMuxer.processSockets(JavaSocketMuxer.java:339)
                    at weblogic.socket.SocketReaderRequest.run(SocketReaderRequest.java:29)
                    at weblogic.work.ExecuteThread.execute(ExecuteThread.java:209)
                    at weblogic.work.ExecuteThread.run(ExecuteThread.java:178)
                    >
                    ####<26-Mar-2014 11:17:39 o'clock GMT> <Notice> <Diagnostics> <Mike-PC> <AdminServer> <[ACTIVE] ExecuteThread: '6' for queue: 'weblogic.kernel.Default (self-tuning)'> <<WLS Kernel>> <> <> <1395832659211> <BEA-320068> <Watch 'LogWatch' with severity 'Notice' on server 'AdminServer' has triggered at 26-Mar-2014 11:17:39 o'clock GMT. Notification details:
                    WatchRuleType: Log
                    WatchRule: (SEVERITY = 'Error')
                    WatchData: DATE = 26-Mar-2014 11:17:39 o'clock GMT SERVER = AdminServer MESSAGE = IOException occurred on socket: Socket[addr=/127.0.0.1,port=58139,localport=7001]
                    java.net.SocketException: recv failed: Descriptor not a socket.
                    java.net.SocketException: recv failed: Descriptor not a socket
                    at jrockit.net.SocketNativeIO.readBytesPinned(Native Method)
                    at jrockit.net.SocketNativeIO.socketRead(SocketNativeIO.java:32)
                    at java.net.SocketInputStream.socketRead0(SocketInputStream.java)
                    at java.net.SocketInputStream.read(SocketInputStream.java:129)
                    at weblogic.socket.SocketMuxer.readFromSocket(SocketMuxer.java:980)
                    at weblogic.socket.SocketMuxer.readReadySocketOnce(SocketMuxer.java:922)
                    at weblogic.socket.SocketMuxer.readReadySocket(SocketMuxer.java:888)
                    at weblogic.socket.JavaSocketMuxer.processSockets(JavaSocketMuxer.java:339)
                    at weblogic.socket.SocketReaderRequest.run(SocketReaderRequest.java:29)
                    at weblogic.work.ExecuteThread.execute(ExecuteThread.java:209)
                    at weblogic.work.ExecuteThread.run(ExecuteThread.java:178)
                    SUBSYSTEM = Socket USERID = <WLS Kernel> SEVERITY = Error THREAD = [ACTIVE] ExecuteThread: '3' for queue: 'weblogic.kernel.Default (self-tuning)' MSGID = BEA-000403 MACHINE = Mike-PC TXID = CONTEXTID = TIMESTAMP = 1395832659211
                    WatchAlarmType: AutomaticReset
                    WatchAlarmResetPeriod: 5000
                    >


                    As they are, these two watches are not too useful. They have alarms configured, but both just write to the server log! Since one of them is a watch on the server log anyway, then why wouldn’t I just look at the server log to see when there were socket errors?

                    This is where notifications come in! I’ll cover notifications in a separate blog post.


                    | View Mike Croft's profile on LinkedIn | Mike CroftonGoogle+

                    How to set up a cluster with Tomcat 8, Apache and mod_jk

                    $
                    0
                    0
                    PART 1  |   PART 2   |   PART 3

                    This is the first in a series of blogs on Tomcat, including basic set-up and clustering, configuration and testing and finally performance tuning and monitoring.


                    Despite the popularity of Tomcat, it seems to have something of a reputation for being a developer’s application server because of how apparently simple and “no-frills” it seems to be, and therefore suited only to the most lightweight of deployments. In reality, many of the features that aren’t included in Tomcat are those that most businesses will never miss (and for those that will, projects like TomEE bring together all the necessaries for a full Java EE profile).

                    In this blog post, I’ll go through a very common scenario for a small production environment – a single tier, load balanced application server cluster.

                    One of the most fundamental concepts in high availability is load balancing work across multiple server instances. The specifics of exactly how that is achieved varies a lot depending on whether you want to scale upadd more server instances to a host – or scale out– add more hosts with server instances on.

                    Getting Started
                    Early releases of Tomcat 8 have been out for a while now and although it’s still in beta at the time of writing (8.0.5), it’s still worthwhile testing it out with common tasks. When beginning any new project like this, it makes sense to do all your testing with the very latest stable version.

                    Nothing we will be using in this blog will make use of a new feature, so although I’m using the latest build, all steps should apply to some older Tomcat versions, certainly Tomcat 7.x

                    The high-level overview of what we will be doing is as follows:


                    1. Download and install Apache HTTP server and mod_jk
                    2. Download Tomcat
                    3. Configure two local (on the same host) Tomcat servers
                    4. Cluster the two Tomcat servers
                    5. Configure Apache to use mod_jk to forward requests to Tomcat

                    I’ve already covered Apache and mod_jk installation, so I won’t go over that a second time although I will say that I am using Xubuntu 13.10 and installing both Apache and mod_jk from the PPA repositories. The packages I downloaded were “apache2” and “libapache2-mod-jk”. Installing these two packages means that both the web server and mod_jk are already configured, and my configuration file for mod_jk is almost exactly the same as Apache’s example and is located in /etc/apache2/mods_enabled/jk.conf.

                    Downloading Tomcat is as straightforward as going to tomcat.apache.org, but it’s a good idea to check the version specification matrix so you’ll know that if you want to test the implementations of the latest specifications you’ll need to download version 8.


                    Configuring the Servers
                    After Tomcat has been downloaded, you’ll need to extract the server to an appropriate location. In my case, that was /opt/tomcat/apache-tomcat-8.0.5

                    Since both of my servers are going to be on the same machine, I will have two server directories. To keep things simple, I just duplicated the directory and added the server name to each (/opt/tomcat/apache-tomcat-8.0.5-server1 andserver2).

                    Before I can start the servers, I need to edit the port numbers to avoid conflicts:

                     mike@ubuntu:~$ vim /opt/tomcat/apache-tomcat-8.0.5-server2/conf/server.xml  
                    <Server port="9005" shutdown="SHUTDOWN">
                    <Listener className="org.apache.catalina.core.AprLifecycleListener" SSLEngine="on" />
                    <Listener className="org.apache.catalina.core.JreMemoryLeakPreventionListener" />
                    <Listener className="org.apache.catalina.mbeans.GlobalResourcesLifecycleListener" />
                    <Listener className="org.apache.catalina.core.ThreadLocalLeakPreventionListener" />
                    <GlobalNamingResources>
                    <Resource name="UserDatabase" auth="Container"
                    type="org.apache.catalina.UserDatabase"
                    description="User database that can be updated and saved"
                    factory="org.apache.catalina.users.MemoryUserDatabaseFactory"
                    pathname="conf/tomcat-users.xml" />
                    </GlobalNamingResources>
                    <Service name="Catalina">
                    <Connector port="9009" protocol="AJP/1.3" redirectPort="9443" />
                    <Engine name="Catalina" defaultHost="localhost">
                    <Realm className="org.apache.catalina.realm.LockOutRealm">
                    <Realm className="org.apache.catalina.realm.UserDatabaseRealm"
                    resourceName="UserDatabase"/>
                    </Realm>
                    <Host name="localhost" appBase="webapps"
                    unpackWARs="true" autoDeploy="true">
                    <Valve className="org.apache.catalina.valves.AccessLogValve" directory="logs"
                    prefix="localhost_access_log" suffix=".txt"
                    pattern="%h %l %u %t &quot;%r&quot; %s %b" />
                    </Host>
                    </Engine>
                    </Service>
                    </Server>

                    Above is the full server.xml for my “server2”. The only difference to the server.xml of server1 is the value of the port attribute in the main Server element and the port and redirectPort attributes in the Connector element. You might also note that I have removed the HTTP connector, leaving only the AJP connector. The reason for that is that I want my web apps to be only accessible through the load balancer, and that communication will be over the more performant AJP protocol. It’s perfectly fine to leave HTTP connectors there while testing.


                    Configuring mod_jk
                    mod_jk requires exactly one workers.properties file where load balancing is configured. “Workers” are defined in the properties file and represent actual or virtual workers.

                     worker.list=loadbalancer,status  
                    worker.server1.port=8009
                    worker.server1.host=localhost
                    worker.server1.type=ajp13

                    worker.server2.port=9009
                    worker.server2.host=localhost
                    worker.server2.type=ajp13

                    worker.server1.lbfactor=1
                    worker.server2.lbfactor=1

                    worker.loadbalancer.type=lb
                    worker.loadbalancer.balance_workers=server1,server2

                    worker.status.type=status


                    The above configuration defines two virtual workers, and two actual workers, which map to my Tomcat servers. The virtual workers “status” and “loadbalancer” are defined in the worker.list property, because I’m going to refer to them later in my apache configuration.

                    Second, I’ve defined workers for each of my servers, using the values from the AJP connectors in the server.xml from earlier. I’ve also included two optional properties for these workers, “lbfactor”. The higher the number of this property, the more preference mod_jk will give that worker when load balancing. If I had given the servers lbfactors of 1 and 3, I would find that the round-robin loadbalancing would prefer one server over the other with a 3:1 ratio.

                    Lastly, I’ve got a little configuration for my virtual workers. I’ve set the loadbalancer worker to have type “lb” and listed the workers which represent Tomcat  in the “balance_workers” property. If I had any further servers to add, I would define them as a worker and list them in the same property. The only configuration that the status worker needs is to set the type to status.


                    Configuring Apache Web Server to forward requests
                    Possibly the easiest part of the configuration, you will need to add the following lines to your Apache configuration:

                         JkMount /status status  
                    JkMount /* loadbalancer

                    If you’ve installed Apache and mod_jk from the Ubuntu package manager, like I have, because you want to get up and running and see how it all works in the quickest time possible, you will need to add this to the default virtual host in the <apache_home>/sites-enabled directory. If you are adding these directives to a virtual host, you should also add the following:

                     JkMountCopy On  


                    Testing it out
                    To test our setup so far, we need to deploy an appropriate webapp. I’m going to use the ClusterJSP sample application, since it’s been around in examples long enough that just googling that phrase will give a long list of places where it’s hosted! Here’s a direct link to the file hosted by JBoss but, should that link become invalid in the future, I’ve no doubt that it will be easy to find elsewhere.

                    Deploying to Tomcat is, like most things, very straightforward. Copy the WAR to the <server>/webapps directory and start Tomcat using the <server>/bin/startup.sh script. If you go to http://localhost/clusterjsp you should now see the page rendered properly.

                    The fourth bullet from the bottom shows the session ID:


                    Going to localhost/status will bring up the mod_jk status page. With our basic configuration, the main section is dedicated to information about the load balancer workers and the two workers it is balancing:


                    If you refresh the clusterjsp page a few times, you should see the effect in the above section. The important columns are “V” and “Acc” which are showing the worker.[workername].lbvalue and worker.[workername].elected properties respectively.

                    The lbvalue (“V”) is the number that the load balancer uses to decide which server to route the next request to. Whichever has the smallest number will get the next request. It’s not a count, although it will look like one if you’ve set the lbfactor to 1 on all workers. If you increase the lbfactor on (for example) server2 to 2 in my case, then you will see that the lbvalue jumps up by two at a time on the server1 worker. This means that more requests go to server2, since its lbvalue is more frequently lower.

                    The number next to it is the elected value, meaning the number of requests which have gone to that server in total. You should see that, as the number of requests increases, the ratio of the elected value on server1 and server2 has roughly the same ratio as you’ve defined in the worker.properties file.


                    Enabling Sticky Sessions
                    If you’ve already read through the mod_jk documentation, you’ll have found that sticky sessions are enabled by default for load balancer workers. If that’s true then why isn’t it letting you carry on your session, rather than providing a new one?

                    The answer is in an attribute of the Engine element of the server.xml that we haven’t yet added: the jvmRoute. To see this in action, I added the jvmRoute attribute to only my server1 server.xml file:

                    <Engine name="Catalina" defaultHost="localhost" jvmRoute="server1">  

                    What this means is that we can see an interesting effect. Making sure that clusterjsp was still loaded, I refreshed a couple of times to see the session ID change a few times. Once I restarted my sever, I refreshed the page again until I saw Tomcat append “.server1” to the session ID:


                    This meant that all of my requests were going to that server. Holding down F5 (a cruel thing to do to a web server, but no Tomcats were harmed in the making of this blog) meant that I was stuck to server1, but all my requests from refreshing so much bumped up the lbvalue of server1 from the JK status page I mentioned earlier.
                    I opened a private browsing tab, so my cookie wouldn’t be used, and went to the clusterjsp page again. The effect now is that I get routed straight to server2, which (if you’re trying this too) you’ll see because the session ID doesn’t have anything appended to it.

                    Refreshing the new tab will keep sending me to server2, maintaining my session because the loadbalancer is trying to bring the lbvalues back into line with each other.

                    Don’t expect that it’s good enough to set your jvmRoute on one server and think that sticky sessions are now working fine, though! If I’d had 3 servers, then my requests would have flip-flopped between the two other servers until all three lbvalues were equal. The other effect is that you’ll find that as soon as the lbvalues are all equal again, you’ll be sent to server1 and stuck to it again!

                    That sort of thing gives very unpredictable behaviour in practice so, if you need to maintain user sessions in Tomcat, make sure you set your jvmRoute!


                    Going Further
                    If you’d like to go deeper with some of the things I’ve covered, you could always try these suggestions:

                    • Install everything from scratch
                      • Don’t use any repository or installer, just unzip and configure everything yourself. You’ll get a much better idea of how things are put together and why things are done the way they are.
                    • Adding another server with a higher load balancer weight to see how many more requests go to that server (removing the jvmRoute to stop sticky sessions, then seeing how things change when you add it back in!)


                    Next in the series, Andy will take a look at some options for configuration and testing!


                    | View Mike Croft's profile on LinkedIn | Mike CroftonGoogle+

                    Configuring Tomcat 8

                    $
                    0
                    0
                    PART 1   |   PART 2  |   PART 3

                    This is the second in a series of blogs on Tomcat, including basic set-up and clustering, configuration and finally performance tuning and monitoring.


                    Introduction

                    Following on from my colleague's blog post looking at basic set-up and clustering, in this blog post I will take a look at some basic configuration settings and some key things most people want to configure. This blog will use the system set up in the first part of this series so if you wish to follow along then set up your system as described there.


                    Tomcat is designed to work out of the box with very little change required to the default values. However, when you do need to make changes to the way it's configured where should you start?

                    All the key config files can be found in the conf directory underneath the main Tomcat directory. Some of the most important ones are:
                    • server.xml - This is the main config file for Tomcat and contains the settings for most of the key Tomcat components.
                    • context.xml - This is a global config file used by all web apps running on Tomcat. If you wish to override the global settings you should create your own context.xml file and place it in the META-INF directory of your web app.
                    • web.xml - This is the global deployment descriptor used by all web apps running on Tomcat. If you wish to override the global settings you should create your own web.xml file and place it in the WEB-INF directory of your web app.
                    • tomcat-users.xml - This file contains details on users and their roles.
                    If you look into these files you will see they are well documented with details of what each setting does.

                    So, let's start configuring our servers.

                    It is highly recommended to make backup copies of any config files before making changes. It should also be noted that if you have your servers set up from the first blog when making config changes you should make the changes to both servers or you may see some odd results!

                    Changing the default home page

                    Firstly, if you have things set up as described in the first blog and you point a browser at your server you will see the default Tomcat page which provides documentation for Tomcat itself (as below)

                    In order to change this you need to remove the contents of <TOMCAT_DIR>/webapps/ROOT and create your own front page called index.html, index.htm or index.jsp in this directory.

                    Creating an admin user and accessing the management interface

                    Tomcat comes with a management web application available at http://localhost/manager. However, if you point your browser at it you will find that by default it is locked down. So, lets fix that now.

                    To enable access you must either create a new username/password combination and associate one of the manager roles with it, or add a manager role to some existing username/password combination.

                    The following roles are available:

                        manager-gui — Gives the user access to the HTML interface.
                        manager-status — Gives the user access to the Server Status page only.
                        manager-script — Gives the user access to a plain text interface and the Server Status page.
                        manager-jmx — Gives the user access to the JMX interface and to the Server Status page.

                    Here we will add a user to access the HTML interface. We will do this by adding a user to the tomcat users file. This file contains an XML element <user> for each individual user.

                    Here we will add a new user with the manager-gui role as follows:

                    <role rolename="manager-gui" />
                    <user name="admin" password="admin" roles="manager-gui" />

                    This defines the username and password used by this individual to log on, and the role names he or she is associated with

                    Usernames and passwords can also be stored in a database or in a directory server accessed via LDAP.

                    If you now point your browser at localhost/manager you should be able to access the management interface with the username and password set in the users file.


                    The management console is very basic and only has a limited set of features but it will allow you to do the following:

                    • Deploy new web apps
                    • List the currently deployed apps
                    • Start and stop your apps
                    • Reload an app
                    • Undeploy an app
                    • List the OS and JVM properties
                    • List JNDI resources


                    Locking admin access to the local machine

                    If you have another machine (or virtual machine) you can access the admin interface from it, as can others.

                    Next up we will lock access down so that access can only be gained from the machine running Tomcat.

                    Edit  <TOMCAT_DIR>/webapps/manager/META-INF/context.xml.

                    Uncomment the following section:

                    <!--
                      <Valve className="org.apache.catalina.valves.RemoteAddrValve"
                             allow="127\.\d+\.\d+\.\d+|::1|0:0:0:0:0:0:0:1" />
                      -->

                    Configuring a datasource

                    Next we will configure a mySQL datasource.

                    Installing mySQL

                    Firstly we need to install mysql. As I'm using Ubuntu we can use the package manager to do so with the following:

                    sudo apt-get install mysql-server

                    You will be prompted for a root password. For test purposes I'm going to use admin.

                    Downloading and installing a JDBC driver

                    Next up we need to download the JDBC driver for connecting to our database. This can be downloaded from here:

                    http://www.mysql.com/products/connector/

                    Extract the zip file to a folder of your choice. In that folder you will find the necessary jar file. In my case this was mysql-connector-java-5.1.30-bin.jar.

                    Copy this file to <TOMCAT_DIR>/lib.

                    Creating a test database

                    Next, we will create a test database.

                    Open up a terminal and run the following command:

                    mysql -u root -p

                    You will be prompted for the root password (admin on my test server).

                    Now we will create a new database, create a test table and add some dummy data.

                    create database testdb;
                    use testdb;

                    create table test_table (id int not null auto_increment primary key, name varchar(20));

                    insert into test_table (name) values("Tom");
                    insert into test_table (name) values("Dick");
                    insert into test_table (name) values("Harry");

                    Configuring the datasource

                    Finally, we will configure our data source. If we configure our datasource in the main config.xml it will be available to all our apps. However, this should generally be avoided as it will create a pool for each context deployed and you will have a very unhappy DBA if you have multiple apps deployed but only one actually needs to access the database!

                    Therefore we will configure our datasource in our applications config.xml.

                    Under your <TOMCAT_DIR>/webapps directory, create a new folder called dbtest.

                    Under this folder create a new META-INF directory.

                    Within that folder create a context.xml file with the following text:

                    <Context>
                    <Resource name="jdbc/testdb" auth="Container" type="javax.sql.DataSource"
                                   maxActive="-1" maxIdle="100" maxWait="5000"
                                   username="root" password="admin" driverClassName="com.mysql.jdbc.Driver"
                                   url="jdbc:mysql://localhost:3306/testdb"/>
                    </Context>

                    OK. So we have configured our datasource. Next up we will create a very basic app to test it. We will then expand this app in later steps to show further configuration.

                    Creating a test app

                    Now our datasource is configured and we have some dummy data in a database let's create a test app to see if it works. Under the dbtest folder create the following structure:

                    dbtest
                    ----> WEB-INF
                    ----> WEB-INF/lib

                    In order to keep things simple we will use Apache's Standard Taglibs. They can be downloaded from here:

                    http://tomcat.apache.org/taglibs/standard/

                    Download the 1.1 version, unzip it to a directory of your choosing and then from the lib directory within that directory copy jstl.jar and standard.jar to the following directory:

                    <TOMCAT_DIR>/webapps/dbtest/WEB-INF/lib

                    This will give your app access to the necessary libraries.

                    Next, we will create a basic jsp page that retrieves the dummy data we put in the database and displays it.

                    Create a file called test.jsp under <TOMCAT_DIR>/webapps/dbtest/ and enter the following:

                    <%@ taglib uri="http://java.sun.com/jsp/jstl/sql" prefix="sql" %>
                    <%@ taglib uri="http://java.sun.com/jsp/jstl/core" prefix="c" %>

                    <sql:query var="rs" dataSource="jdbc/testdb">
                    select id, name from test_table
                    </sql:query>

                    <html>
                      <head>
                        <title>DB Test</title>
                      </head>
                      <body>

                      <h2>Results</h2>

                    <c:forEach var="row" items="${rs.rows}">
                        ID ${row.id}<br/>
                        Name ${row.name}<br/>
                    </c:forEach>
                      </body>
                    </html>

                    This should be fairly simple to follow. All it does is uses the sql taglib to retrieve the data we want and then the core taglib to loop through that data displaying the results. The implementation isn't that important right now, we just want to test that we can access our data source.

                    If you now point your browser at http://localhost/dbtest/test.jsp you should see the following:

                    Results

                    ID 1
                    Name Tom
                    ID 2
                    Name Dick
                    ID 3
                    Name Harry

                    Error Handling

                    Finally I'm going to take a look at error handling.

                    First of all, let's create a page that we know will throw an error and add it to our previous app.

                    Create a new file called error.jsp under <TOMCAT_DIR>/webapps/dbtest.

                    Add the following text:

                    <html>
                    <head>
                       <title>Error Handling Example</title>
                    </head>
                    <body>
                    <%
                       // Throw an exception to invoke the error page
                       int x = 1;
                       if (x == 1)
                       {
                          throw new RuntimeException("Something went wrong!");
                       }
                    %>
                    </body>
                    </html>

                    Now point your browser at http:// localhost/dbtes/error.jsp

                    You will see the full stack trace and details on the error.

                    The default error pages that Tomcat uses often include information about your server that you don't want others to see (file paths, configuration information, stack traces etc.). These can be very useful in development but not when your system goes live. Therefore we want to create our own error pages.

                    Now point your browser at http://localhost/dbtest/x.jsp

                    Here you will see the standard 404 - page not found error.

                    You can either set error pages in the main web.xml or in your app's web.xml depending if you want different error pages for different apps.

                    In my case I'm going to alter them for my individual app.

                    Create a new web.xml file in <TOMCAT_DIR>/webapps/dbtest/WEB-INF and enter the following:

                    <web-app xmlns="http://java.sun.com/xml/ns/j2ee"
                     xmlns:xsi="http://www.w3.org/2001/XMLSchema-instance"
                     xsi:schemaLocation="http://java.sun.com/xml/ns/j2ee http://java.sun.com/xml/ns/j2ee/web-app_3_0.xsd"
                     version="3.0">

                    <error-page>
                          <error-code>500</error-code>
                          <location>/errors/500_error.html</location>
                       </error-page>

                    <error-page>
                          <error-code>404</error-code>
                          <location>/errors/404_error.html</location>
                       </error-page>
                    </web-app>

                    This tells Tomcat that all 500 errors (Internal Server Error) should be redirected to the page 500_error.html in the errors directory of your app and that all 404 errors (Page Not Found) should be redirected to the page 404_error, also in the errors directory of your app.

                    Note - you can also do the following if you wish to capture specific Java exceptions:

                    <error-page>
                        <exception-type>java.lang.Exception</exception-type>
                        <location>/errors/exception.html</location>
                    </error-page>

                    Now create 500_error.html and 404_error.html pages in 

                    <TOMCAT_DIR>/webapps/dbtest/errors

                    Now if you go to:

                    http://localhost/dbtest/error.jsp

                    and 

                    http://localhost/dbtest/x.jsp

                    you should see your own personalised error pages rather than the default ones.

                    Conclusion

                    Well, that concludes this brief look into configuring Tomcat. Hopefully I've covered enough to give you some ideas about configuring your own servers and shown that the basics are pretty straightforward.

                    In the final part of this series my colleague will look at performance tuning and monitoring. Stay tuned!


                    Building GlassFish from Source

                    $
                    0
                    0

                    Introduction
                         This blog will look at building Glassfish 4.0.1 from source and configuring NetBeans 8.0 to then use, modify, and debug it. While GlassFish can be downloaded ready for use, even coming bundled with NetBeans, there will be some among us who need (or just want) to build it from scratch. This build was conducted using a 64bit Linux Distro, JDK 1.7.0_55, Maven 3.2.1, and SVN 1.8.8.

                    Building GlassFish
                         If you want to see the official instructions from Oracle for building GlassFish (which was my first port of call), follow this link: https://wikis.oracle.com/display/GlassFish/FullBuildInstructions

                         Despite initially sounding complex, building GlassFish from source is a fairly straightforward thing to do; the most complex thing required of you is to configure some Maven parameters! Let’s start off with this, as it’s a step that you don’t want to get wrong, lest you find yourself waiting for Maven to install GlassFish to only then give up after 20 minutes!

                    Configuring Maven
                         Create a MAVEN_OPTS environment variable and set it as:

                         -Xmx1024M -XX:MaxPermSize=512m 

                         This is to stop Maven from running out of memory; the default settings do not provide enough memory for it to successfully complete the installation. If you are fortunate to have a surplus of memory, feel free to bump this up! With the “hard” bit done, let’s now get the GlassFish source code.

                    Getting the Source Code
                         Being open-source, GlassFish can be downloaded and modified for free. To download the source code, navigate to where you would like the files to be downloaded to with the terminal and use the following command (make sure you have it on your path if it isn't by default):

                         svn checkout https://svn.java.net/svn/glassfish~svn/trunk/main
                     
                         This will download the source code to a folder called main in the current directory. With that done, it’s about time we got down to building GlassFish.

                    Building GlassFish
                         If all goes well, GlassFish can be built with a single command; told you it was relatively simple! Navigate into the main directory with the terminal, and run the following command (again, make sure you have it on your path):

                         mvn install

                         If you want to save a bit of time when building GlassFish, you can append the install command with the following flag to skip all of the tests:

                         -DskipTests

                         If you find that it throws a “peer not authenticated” error, this is due to the JVM not trusting the certificates of the Maven repository. To get around this, you can temporarily disable the certificate validation of Maven by appending the following flags to the install command:

                         -Dmaven.wagon.http.ssl.insecure=true –Dmaven.wagon.http.ssl.allowall=true

                         Whilst it would be better to configure the JVM to trust the certificates so these flags aren’t necessary, it’s outside the scope of this blog.

                         The first build can take a while to complete, so unless you find watching the log text scrolling by particularly mesmerising, find something to do for about 20-30 minutes.

                    Using GlassFish as an Application Server
                         Once GlassFish has been built, we can use it just like as if we’d downloaded it pre-compiled.
                    • From NetBeans, expand the Tools drop-down list from the toolbar, select Servers, and click on Add Server.
                    • From the new popup window, select GlassFish Server from the server type list, and give it a name, before clicking Next.
                    • You will be presented with the Server Location window, prompting you to enter the GlassFish installation location. For our newly built GlassFish server, this can be found at:
                      • install_dir/main/appserver/distributions/glassfish/target/stage/glassfish4 (where install_dir refers to the directory that main is located in)
                    • At the next window, leave the settings as their defaults.
                         With that, our GlassFish server should now be configured and ready to be started!

                    Modifying GlassFish
                         NetBeans natively understands Maven due to a bundled plugin, so using NetBeans to modify the Glassfish code is as easy as opening any other project. Simply open the main folder as a project, and then browse through the modules for the one you wish to modify or add to.

                         As an example, let’s break GlassFish!
                    • Load GlassFish (the main directory) into NetBeans.
                    • Open the Core Bootstrap Classes module: Modules, GlassFish Nucleus Parent Project, GlassFish Nucleus Core modules, Appserver Core Bootstraping Classes glassfish-jar. (The typo of Bootstraping is actually there at time of writing!). 
                    • Open up the MainHelper class for editing by double clicking on it from the Projects pane.
                         From here, let’s make a little mayhem by changing a single number. Scroll down to the checkJdkVersion() method, and change the if statement from this:
                     if (minor < 7) { 
                         To this:
                     if (minor < 12) { 
                         In human speak, this means the Java code is no longer checking if the JDK being used is less than JDK 7, and instead is checking if the JDK being used is less than JDK 12. This will cause GlassFish to exit immediately upon trying to start a domain; a nice, easy way to see if our change has actually taken effect.

                         Make sure you’ve saved the change for it to be compiled, and then open up a terminal. Navigate to the main directory, and execute the following command to build our changes:

                         mvn install -pl nucleus/core/bootstrap –amd

                         This command will only build the specified module and those that are dependent upon it. The –pl (projects) flag specifies the specific projects to build, and the –amd (also-make-dependents) flag specifies that all dependent modules also be built. For future reference, if you change more than one module, the –pl flag allows you to specify multiple modules in a comma separated list like this: 

                         mvn install –pl module1_path,module2_path.

                          If you want to be thorough (which is best if you want to properly test your changes), just rebuild the entire code; it will likely not take as long as the first time.

                         Once Maven has finished working its magic, navigate to the GlassFish bin directory, install_dir/main/appserver/distributions/glassfish/target/stage/glassfish4/glassfish/bin, and try to start the domain (./asadmin start-domain). You should get an error message that makes GlassFish sound a little unreasonable (below), proving that our change has taken effect.

                         The server exited prematurely with exit code 1.
                         Before it died, it produced the following output:
                         Apr 25, 2014 10:38:44 AM com.sun.enterprise.glassfish.bootstrap.MainHelper checkJdkVersion
                         SEVERE: GlassFish requires JDK 7, you are using JDK version 7. 

                    Debugging GlassFish
                         Change back the if statement we modified in the previous section to its original value, and rebuild the module using the same command as before (it helps to have a working GlassFish to continue!).

                         To debug GlassFish, we first need to set up our debugger:
                    • From NetBeans, start the GlassFish Server in debug mode. 
                    • Click on the Debug drop-down from the toolbar, and select Attach Debugger.
                    • Use the JDPA debugger, with a SocketAttach Connector. The host will be the localhost(or the name of your machine), and the Port should be 9009 (the GlassFish default).
                    • Open the Window drop-down from the toolbar, expand the Debugging list, and click on Sources to open the Sources window.
                    • Right click in the Sources window, select Add Source Root, and add the main directory.
                         If everything has gone smoothly, you should see the main directory be present in the Sources window, signifying that we've now linked the source code to our GlassFish Server, ready to be debugged. Let's just check it's working with a quick example before we start celebrating:
                    • Open the RestResponse class, found under GlassFish Appserver Parent Project, Admin Console Packages, Admin Console Common glassfish-jar (you may notice that the path to this module will be added to the Sources window).
                    • In the getResponseCode() method, add in the highlighted line before the large if statement, such that it looks like this (feel free to alter the message):
                     ...
                    String contentType = response.getHeaderString("Content-type");
                    Logger.getLogger(RestResponse.class.getName()).log(Level.INFO, "Help me! The author keeps breaking me!");
                    if (contentType != null) {
                    ...
                    • Add in a break point on our newly added line.
                    • Save and then rebuild GlassFish with Maven.
                    • Restart GlassFish in debug mode and re-attach the NetBeans Debugger (you don't need to add the source root again).
                    • Open up a browser and navigate to the Admin Console.
                          The break point should trigger, and if you step over or continue a few times, you will see our logger message being output in the GlassFish Server pane of the Output window.
                      Wrapping Up
                      Captain Picard face-palming: one bracket missing, whole coding is screwed up     And with that, you should now have built GlassFish from source and taken your first steps on modifying and debugging it. Have fun, and remember to make backups; we just aptly showed how easy it is to break it!


                      Tomcat Performance Monitoring and Tuning

                      $
                      0
                      0

                      PART 1   |   PART 2   |   PART 3

                      This is the third and final part in the blog series on Tomcat whereby we will discuss some of the various options available to monitor Tomcat performance and also describe some of the configuration parameters we can tune to optimize Tomcat application performance. Finally we will introduce the Byteman framework which can be used to instrument and profile applications


                      Introduction


                      Following on from Andy's blog post looking at some of the many ways we can configure Tomcat for example to restrict administration access and error page handling within applications, we will be using the same server topology used in this series whereby we have a single Apache server instance which load balances requests to two different tomcat instances in the cluster.


                      Currently, there is a vast array of both open source and commercial monitoring tools on the market today and the many different ways in which we can tune a Tomcat instance depending on project requirements. In this blog, we will narrow our discussion to a specific number of tools we can use for monitoring and also focus on specific configuration parameters for tuning various resources. We will cover the following areas in this blog:

                      1) Provide an overview of the application we will use for testing and Apache JMeter setup

                      2) How to enable JMX Monitoring on Tomcat and provide an overview of some of the JMX Monitoring metrics in JConsole.

                      3) Monitoring and Tuning JVM Heap performance

                      4) Application Testing using a fixed number of test scenarios and demonstrate how performatce tuning can aid application request throughput and performance.

                      5) Instrumenting an application using the instrumentation framework called Byteman.

                      Application Overview

                      In this blog, we will use a very simple web application for performance testing purposes which will consist of a simple servlet class which will will retrieve a list of existing product orders from a mysql database instance and display them to the user in a browser. Both the source code and packaged war file can be downloaded from here.

                      We will also use here Apache JMeter 2.1.1 to allow us perform some simple load testing against the deployed web application above for a set different configuration settings in tomcat and measure performance using JConsole.

                      JConsole Overview

                      To monitor performance on each tomcat instance we will use JConsole which comes with JDK 1.7 Hotspot. We will run JConsole locally rather than remotely however if you wish to set up your tomcat instances to remotely accessed then please follow this link. There is no extra set up required to allow us to access the various JMX Mbeans attributes and operations in JConsole.

                      We will now provide a brief overview of some of the default MBean categories available for Tomcat which are listed in Figure 1.

                      Connector
                      The connector category provides an overview of the different connectors and the various mbean attribute values. We have defined two connectors in each tomcat server.xml file, one to accept http traffic and the other to accept AJP requests from an Apache load balancer. The attributes section lists all the connector configuration values we have specified in server.xml along with the default values for various connector attribute values.

                      DataSource

                      In this section, we can view all the data sources which we have defined with applications deployed to each tomcat instance. Furthermore, we can view the configuration values set on each data source and the default values if we have not explicitly set these values in the file context.xml defined within the deployed application. Finally, we can observe the state of each connection used in the application.

                      ThreadPool

                      In this category, we can view the thread pool configuration details used by the different connector types. On both tomcat instances we have defined we have two pools, one for service AJP and another to service http requests.

                      RequestProcessor

                      The request processor category will list mbean metrics associated with each of the threads in the AJP and http connection pool. For example we can ascertain, how log it took to process the last request, the maximum request time to process a request on that thread and the number of requests it has handled.

                      GlobalRequestProcessor

                      In this category, we can observe from the mbean attribute values listed the maximum amount of time it took to process a request overall, the cumulative number of errors while processing all requests and the total number of requests handled by all threads on the server.


                      Figure 1: Catalina Default JMX Categories


                      Application Testing and Parameter Tuning
                      In this section, we will discuss multiple different application performance issues which we have contrived. In the first scenario, we  will modify the application above so that pooled connections used by the application are not returned to the pool and so create a connection leak within the application.

                      We will then describe 2 different scenarios: one whereby there are insufficient resources allocated to the tomcat server instances to service request loads in a timely manner. In the second scenario using the same load test as in scenario one, we will apply some basic performance tuning to the application and the tomcat server instances to improve performance. We will use JMeter for performance testing and JConsole to observe monitoring metrics. We should note we ran this simple load test 10 times to verify the results we observed below. The results below are a sample from one of these tests and are indicative of the pattern we observed. The application source code, web application war files and JMeter tests can be found here.

                      Scenario 1: Connection Leak Detection

                      In the first scenario, we will deliberately change the application so as to not close connections the application uses and so create a connection leak within the running application deployed to the two tomcat instances.  We will now briefly overview the jmeter and tomcat configuration details.

                      1) Apache JMeter Setup

                      The Apache JMeter test script named DBTestGroup.jmx consists of a thread group of 1000 threads whereby a http servlet request is made every second.

                      2) Connection Pool Setup

                      In the test web application deployed to each tomcat, we have configured a connection pool with 10 database connections whereby connections which are abandoned will be logged in the log file named catalina.out since the "logAbandoned" attribute is set to "true". We can view the connection pool configuration below which is deployed along with the application in a file named context.xml:

                      <Context>
                      <Resource name="jdbc/productdb" auth="Container" type="javax.sql.DataSource"
                                     maxTotal="10" maxIdle="30" maxWaitMillis="10000" logAbandoned="true"
                                     username="xxxx" password="xxxx" driverClassName="com.mysql.jdbc.Driver"
                                     url="jdbc:mysql://localhost:3306/products"/>
                      </Context>

                      We will now execute the JMeter test described above and view the tomcat logs for connection issues. We can observe the two exceptions below, the first whereby it would appear we are unable to obtain a connection from the connection pool and the second stating that database connections are being abandoned. 

                      1)
                      java.sql.SQLException: Cannot get a connection, pool error Timeout waiting for idle object
                      at org.apache.tomcat.dbcp.dbcp2.PoolingDataSource.getConnection(PoolingDataSource.java:110)at org.apache.tomcat.dbcp.dbcp2.BasicDataSource.getConnection(BasicDataSource.java:1413)
                      at org.winters.tomcat8tests.DirectoryRetrieval.getOrderDetails(DirectoryRetrieval.java:63)

                      2)
                      Abandoned connection log message:
                       org.apache.catalina.loader.WebappClassLoader.clearReferencesThreads Stack trace of thread "Abandoned connection cleanup thread":
                       java.lang.Object.wait(Native Method)
                       java.lang.ref.ReferenceQueue.remove(ReferenceQueue.java:135)


                      Scenario 2: Poorly Tuned Instances

                      In this second scenario, we will run a JMeter test which execute 5000 requests against both tomcat instances whereby we will not change the configuration of the AJP connector from the default values and where we have a maximum of 10 database connections in the pool to service database requests. We can view the AJP connector settings, database pool settings and JVM heap settings used below.


                      1) AJP Connector configuration:

                      <Connector port="8009" protocol="AJP/1.3" redirectPort="8443"/>

                      2) Database Pool Configuration:

                      <Resource name="jdbc/productdb" auth="Container" type="javax.sql.DataSource"
                                     maxTotal="10" maxIdle="30" maxWaitMillis="10000" logAbandoned="true"
                                     username="root" password="admin" driverClassName="com.mysql.jdbc.Driver"
                                     url="jdbc:mysql://localhost:3306/products"/>
                      </Context>

                      3) JVM Settings:

                      We have set the minimum and maximum heap size to 1GB respectively as below:

                      export CATALINA_OPTS="-Xms1024m -Xmx1024m"


                      Results

                      Although JMeter provides us with saome useful performance statistics, we will JConsole to monitor the performance of the test. We can observe below in Figure 2 and 3 that the maximum time to process a request out of 1878 requests processed by one of the Tomcat servers took 4858 milliseconds whereby it took 373041 milliseconds to process 1878 requests. In Figure 3, we can find out metrics for each of the AJP threads used to process requests. We have provided an example of just one here whereby it took just 73 milliseconds to process the last request whereby the maximum time to process any one request on this thread took 4744 milliseconds.


                      Figure 2: GlobalRequestProcessor Mbean Attribute Values


                      Figure 3: RequestProcessor Mbean Attribute Values

                      Scenario 3: Optimized Tomcat Instances

                      In this final test scenario, we will perform some basic tuning on both tomcat instances to the AJP connector configuration in server.xml, the connection pool configuration described in context.xml and the JVM heap size allocated to each Tomcat instance.

                      1) AJP Connector configuration:

                      The AJP connector configuration below is configured so that there are two threads allocated to accept new connections. This should be configured to the number of processors on the machine however two should be suffice here. We have also allocated 400 threads to process requests, the default value is 200. The "acceptCount" is set to 100 which denotes the maximum queue length to be used for incoming connections. The default value is 10. Lastly we have set the minimum threads to 20 so that there are always 20 threads running in the pool to service requests.

                       <Connector port="8009" protocol="AJP/1.3" redirectPort="8443" acceptorThreadCount="2" maxThreads="400" acceptCount="200" minSpareThreads="20"/>

                      2) Database Pool Configuration:

                      We have modified the maximum number of pooled connections to 200 so that there are ample connections in the pool to service requests.

                      <Context>
                      <Resource name="jdbc/productdb" auth="Container" type="javax.sql.DataSource"
                                     maxTotal="200" maxIdle="30" maxWaitMillis="10000" logAbandoned="true"
                                     username="xxxx" password="xxxx" driverClassName="com.mysql.jdbc.Driver"
                                     url="jdbc:mysql://localhost:3306/products"/>
                      </Context>

                      3) JVM Settings:

                      Since we have increased the maximum number of pooled connections and AJP connector thread thresholds above, we should increase the heap size appropriately. We have set the minimum and maximum heap size to 2GB respectively as below:

                      export CATALINA_OPTS="-Xms2048m -Xmx2048m"

                      Results

                      We can observe from the JConsole Mbean metrics below there is a significant improvement in performance. The maximum time it took to process a request is 2048 milliseconds and the overall processing time to handle 3464 requests is 206741 milliseconds. If we observe the result sin Figure 5 from an individual AJP thread, we can observe it took 46 milliseconds to process the last request whereby the maximum time it took to process a request on this thread is 1590 miliseconds. This particular thread has processed 141 requests whereby it took a total time of 5843 milliseconds to process these requests.


                      Figure 4: GlobalRequestProcessor Mbean Attribute Values


                      Figure 5: RequestProcessor Mbean Attribute Values

                      For more details on tomcat 8 connector parameters, please visit this link


                      JVM Heap Monitoring and Tuning

                      Specifying appropriate JVM heap parameters to service your deployed applications on tomcat is paramount to application performance. There are a number of different ways which we can monitor JVM heap usage including using JDK hotspot tools such as jstat, JConsole etc however to gather detailed on when and how garbage collection is being performed, it is useful to turn on GC logging on the Tomcat instance. We can turn on GC logging by modifying the catalina start up script with the following command:

                      JAVA_OPTS="$JAVA_OPTS -verbose:gc -Xloggc:gc.log -XX:+PrintGCDetails -XX:+PrintGCTimeStamps -XX:+PrintGCDateStamps"

                      We can set the minimum and maximum heap size, the size of the young generation and the maximum amount of memory to be allocated to the permanent generation used to store application class metadata by specifying the setting the CATALINA_OPTS parameter by executing this command:

                      export CATALINA_OPTS="-Xms1024m -Xmx2048m -XX:MaxNewSize=512m -XX:MaxPermSize=256m" 

                      Code Instrumentation

                      Byteman is a tool which simplifies tracing and testing of Java programs. Byteman allows you to insert extra Java code into your application, either as it is loaded during JVM startup or even after it has already started running. The injected code is allowed to access any of your data and call any application methods, including where they are private. You can inject code almost anywhere you want and there is no need to prepare the original source code in advance nor do you have to recompile, repackage or redeploy your application. Byteman works by modifying the bytecode of your application classes at runtime whereby we can install and uninstall rules to inject traces into a running application using the bminstall and bmsubmit scripts. In this section, we will demonstrate how to use the byteman instrumentation framework with the Tomcat instances in our topology.

                      The syntax of a Byteman rule follows this pattern:

                      RULE <rule name>
                      CLASS <class name>
                      METHOD <method name>
                      BIND <bindings>
                      IF   <condition>
                      DO   <actions>
                      ENDRULE

                      The RULE keyword identifies the rule name (Rule names do not have to be unique but it obviously helps when debugging rule scripts if they clearly identify the rule).

                      The CLASS can identify a class either with or without the package qualification.

                      The METHOD name can identify a method with or without an argument list or return type.

                      The BIND specification ca be used to bind application variable into rule variables which can subsequently be referenced in the rule body.

                      The IF section can be ovbiously used to check Rule conditions

                      The DO section is the Rule action which can be a rule expression, return values or throw action


                      To instrument our application, we have created a basic rule named servletmonitor.btm which will be invoked each time a http service method is invoked which will output to the catalina.out log file the current counter value tracking the number of times the servlet instance has been invoked:

                      RULE Count All Successful Servlet Invocations
                      CLASS javax.servlet.http.HttpServlet
                      METHOD service(javax.servlet.http.HttpServletRequest, javax.servlet.http.HttpServletResponse)
                      AT EXIT
                      BIND servletPath = $1.getServletPath(),
                           contextPath = $1.getContextPath()
                      IF TRUE
                      DO createCounter("servlet.allInvocations", 0)
                         ,incrementCounter("servlet.allInvocations")
                         ,traceln("[BYTEMAN] *** ServletTrace: allInvocations=[" + readCounter("servlet.allInvocations") + "]")
                         ,traceln("[BYTEMAN] *** ServletTrace: allInvocations=[" + readCounter("servlet.allInvocations") + "], Path=[" + contextPath + servletPath + "]")     
                        ,traceStack("[BYTEMAN] *** traceStack: " + $0)
                      ENDRULE

                      We will now modify the catalina.sh startup script to use the "javaagent" jvm command line parameter whereby Byteman requests will be received on port 9096 on host 192.168.1.65 which is the same as the Tomcat host machine.  We have also allocated 1GB of heap to the byteman instance. We have set up Byteman here to install the rule above however just to note it is not necessary to this as we could using the bmsubmit utility to install and uninstall this rule as necessary.

                      BYTEMAN_OPTS="-Dorg.jboss.byteman.verbose=true -Dorg.jboss.byteman.transform.all -javaagent:/home/andy/Downloads/byteman-download-2.1.4.1/lib/byteman.jar=script:/home/andy/Downloads/byteman-download-2.1.4.1/rules/servletmonitor.btm,boot:/home/andy/Downloads/byteman-download-2.1.4.1/lib/byteman.jar,boot:/home/andy/Downloads/byteman-download-2.1.4.1/sample/lib/byteman-sample.jar,listener:true,port:9096,address:192.168.1.65"
                        
                      JAVA_OPTS="$BYTEMAN_OPTS -Xms1024m -Xmx1024m -XX:MaxPermSize=256m $JAVA_OPTS"

                      We can now run some simple JMeter tests and observe the log output below whereby we can view the trace messages generated by Byteman as specified in the rule servletmonitor.btm

                      Catalina.out log file output:

                      Installed rule using default helper : Count All Successful Servlet Invocations
                      Count All Successful Servlet Invocations execute
                      Count All Successful Servlet Invocations execute
                      Count All Successful Servlet Invocations execute
                      [BYTEMAN] *** ServletTrace: allInvocations=[1]
                      [BYTEMAN] *** ServletTrace: allInvocations=[2], Path=[/TomcatDBTest/DirectoryRetrieval]
                      [BYTEMAN] *** ServletTrace: allInvocations=[2]
                      [BYTEMAN] *** ServletTrace: allInvocations=[2], Path=[/TomcatDBTest/DirectoryRetrieval]
                      [BYTEMAN] *** ServletTrace: allInvocations=[3]
                      [BYTEMAN] *** ServletTrace: allInvocations=[3], Path=[/TomcatDBTest/DirectoryRetrieval]
                      [BYTEMAN] *** traceStack: org.winters.tomcat8tests.DirectoryRetrieval@7c13dd72javax.servlet.http.HttpServlet.service(HttpServlet.java:671)
                      javax.servlet.http.HttpServlet.service(HttpServlet.java:725)
                      org.apache.catalina.core.ApplicationFilterChain.internalDoFilter(ApplicationFilterChain.java:301)

                      Summary

                      In this blog, we have demonstrated how to monitor Tomcat using JConsole to monitor performance and also demonstrated by using some basic tuning how we can improve Tomcat performance. Finally, we provided a brief introduction to the Byteman instrumentation framework and how we can use it with Tomcat to gather useful metrics and to trace application code at runtime with little overhead. There are other tools which we one could explore for performance monitoring such as RHQ, Hyperic and using embedded administration user interfaces and tools in Tomcat to gather performance metrics.


                      Hadoop v2 overview and cluster setup on Amazon EC2

                      $
                      0
                      0

                      In this blog, we will provide a brief overview of the new architecture of Hadoop 2, discuss how to set up a simple 3 node Hadoop 2 ( Hadoop 2.4) cluster on Amazon EC2 and demonstrate how to execute MapReduce jobs on the cluster. Finally, we will discuss how to monitor and perform basic diagnosis should issues occur while running MapReduce jobs

                      Hadoop 2 Overview
                      There have been a number of notable changes to the architecture of Hadoop from version 1 to version 2. In Hadoop v1, the job scheduler daemon which is responsible for resource management, job scheduling and monitoring is a major scalability bottleneck whereby an Hadoop cluster could only scale to approximately 4000 nodes before performance degradation issues occurred. Furthermore, the name node daemon represented a point of failure within the Hadoop cluster although one could use a secondary name node to store cluster-wide HDFS (Hadoop Distributed File System) metadata. Also, the Hadoop architecture was closely coupled to the MapReduce framework whereby this limited the possibility of running different distributed processing and machine learning frameworks on Hadoop. 

                      Hadoop v2 addresses these scalability, failover and integration concerns via YARN and HDFS federation. YARN (yet another resource negotiator) is responsible for cluster resource scheduling, job scheduling and  HDFS federation which allows for multiple namenodes/namespaces to be defined across the cluster to store and manage HDFS data in a cluster. The Node manager is a new process in the Hadoop 2 architecture which runs on nodes in the cluster to manage resourcing needs between the node it is deployed on and the resource manager.


                      Figure 1: Hadoop 2 integration with other frameworks.

                      Hadoop Process Overview
                      The Hadoop 2 runtime environment relies on a number of process components to communicate with each other to successfully execute jobs. The resource manager consists of two principal components: a job scheduler and an application manager. The application manager is responsible for accepting new jobs submitted by clients and the scheduler is responsible for allocating sufficient resource by communicating with the node manager hosted on each host and via the application master residing on nodes in the cluster. The node manager is responsible for providing updates to the resource manager on resource usage per node and for containers running on that node. Finally, the application master is responsible for negotiating with the resource manager that there are sufficient containers to successfully execute application jobs.


                      Figure 2: YARN and a process communication overview on Hadoop 2.

                      Setup and Configuration
                      In this section, we will discuss setting up a cluster of 3 EC2 instances, setting up SSH between the master node and slave nodes and finally the steps to install Hadoop 2.4 on the cluster. In the next section, we will discuss how to run the various Hadoop processes on the cluster and how to test the cluster using a sample MapReduce job.

                      Amazon EC2 Setup

                      Prerequisites:

                      We are assuming here that you have already created an EC2 AMI (ubuntu) with an appropriate instance type, security group, have access to the security key-pair and the 3 EC2 instances are already running which we can verify using the AWS console. We have provided in the section labelled "Example Settings" some details on the configuration we used in the test set up here. In Figure 3 we have provided an overview of the 3 instances running on EC2 and the various Hadoop daemons running on each node.


                      Figure 3: Hadoop2 Cluster Overview with process details per node.

                      Example Settings:

                      Here is a guideline to some of the security configuration and instance type details used in this test set up.
                      • We created a new security group in AWS and set up the following inbound rules (Figure 4) for the security group. You would normally define rules which are more restrictive by modifying the source and port range for each protocol however the cluster has been set up for testing purposes to allow open communication between host instances in the cluster.


                        Figure 4: Inbound Rule definitions defined in the security group
                        • Instance Type: m3:large. There are multiple different image types depending on your application requirements but we chose a general purpose instance type for testing purposes. For more details on the different types navigate to http://aws.amazon.com/ec2/instance-types/
                        • We created a new key pair  to control access to the EC2 instances. You can modify the storage required by each instance however I used the default for this instance type.
                        SSH and Networking Configuration

                        We will discuss in this section what steps we implemented to allow master and slaves nodes to communicate with each other. We are assuming here that SSH has already been installed and is configured to allow for RSA authentication on each node. You can check the master and slave node SSH configuration file which is normally located in /etc/ssh/sshd_config file.

                        1) Log onto each instance using putty or another SSH tool and ensure all master and slaves nodes can ping each other. 

                        2) Configure SSH on the master and slave nodes so that the master node can communicate with all slaves without being prompted for a pass phrase by completing the following:
                        a) On each of the two slave nodes execute: ssh-keygen -t rsa, do not enter a passphrase and accept the default values.
                        b) This will generate a new private and public key pair by default in the directory ~/.ssh named id_rsa and id_rsa.pub respectively.
                        c) Append the public key named id_rsa.pub from each slave machine to the authorized_keys file on the master. 

                        3) You should be able to connect via SSH from the master to each of the slave nodes without issue. If not, check the permissions which have been set on the authorized_keys file and for the directory .ssh on the master and slaves nodes.

                        4) The last step is to configure the network hosts file on the master and slave nodes so all the master and slave private ip addresses are visible in each hosts file. For example on the master, I have set up the master hosts file with these details:

                        10.210.186.157 master1
                        10.75.31.5 slave1
                        10.89.4.229 slave2

                        Hadoop Installation and Configuration

                        To install and configure hadoop on the master and slave nodes, we need to perform the following steps:

                        1) Install JDK Hotspot version 1.6 or above. 
                        2) Download the Hadoop installation file to each of the master and slave nodes. The latest version is 2.4 at the time of writing and can be downloaded from here
                        2) Extract the installer to the appropriate directory on each cluster node and modify the hadoop_env.sh script to point to the location of the environment variable JAVA_HOME
                        3) Set up the following Hadoop environment variables by setting these values in the .bashrc file on all nodes. Configure these values to suit your specific environment:

                        export JAVA_HOME=/home/ubuntu/installs/jdk1.6.0_45
                        export HADOOP_PREFIX=/home/ubuntu/installs/hadoop/hadoop-2.4.0
                        export PATH="/home/ubuntu/installs/hadoop/hadoop-2.4.0/etc/hadoop:/home/ubuntu/installs/hadoop/hadoop-2.4.0/bin:/home/ubuntu/installs/jdk1.6.0_45/bin:~/installs/hadoop/hadoop-2.4.0/sbin:$PATH"
                        export HADOOP_HOME=/home/ubuntu/installs/hadoop/hadoop-2.4.0
                        export HADOOP_MAPRED_HOME=$HADOOP_HOME
                        export HADOOP_COMMON_HOME=$HADOOP_HOME
                        export HADOOP_HDFS_HOME=$HADOOP_HOME
                        export YARN_HOME=$HADOOP_HOME
                        export HADOOP_CONF_DIR=$HADOOP_HOME/etc/hadoop
                        export YARN_CONF_DIR=$HADOOP_HOME/etc/hadoop

                        3) We will now perform some basic configuration to configure the Hadoop cluster. On the master and slave nodes navigate to $HADOOP_HOME/etc/hadoop and modify the following files to configure yarn, set up the dfs replication factor and to setup mapreduce.

                        a) core-site.xml 

                        <configuration>
                          <property>
                            <name>fs.default.name</name>
                            <value>hdfs://<master_private_ip>:9000</value>
                          </property>
                          <property>
                            <name>hadoop.tmp.dir</name>
                            <value>/home/ubuntu/installs/hadoop/hadoop-2.4.0/tmp</value>
                          </property>
                        </configuration>

                        b) yarn-site.xml

                        <configuration>
                          <property>
                            <name>yarn.nodemanager.aux-services</name>
                            <value>mapreduce_shuffle</value>
                          </property>
                          <property>
                            <name>yarn.nodemanager.aux-services.mapreduce.shuffle.class</name>
                            <value>org.apache.hadoop.mapred.ShuffleHandler</value>
                          </property>
                          <property>
                            <name>yarn.resourcemanager.resource-tracker.address</name>
                            <value><master_private_ip>:8025</value>
                          </property>
                          <property>
                            <name>yarn.resourcemanager.scheduler.address</name>
                            <value><master_private_ip>:8030</value>
                          </property>
                          <property>
                            <name>yarn.resourcemanager.address</name>
                            <value><master_private_ip>:8040</value>
                          </property>
                         </configuration>

                        c) hdfs-site.xml

                         <configuration>
                           <property>
                             <name>dfs.replication</name>
                             <value>2</value>
                           </property>
                           <property>
                             <name>dfs.permissions</name>
                             <value>false</value>
                           </property>
                         </configuration>

                        d) mapred-site.xml

                        <configuration>
                         <property>
                           <name>mapreduce.framework.name</name>
                           <value>yarn</value>
                         </property>
                        </configuration>

                        For further details on the configuration of these files and the various different parameters visit this page.

                        4) On the master node only, modify the file "slaves" in HADOOP_HOME/etc/hadoop to list the private ip addresses of the slave nodes so that the node manager and data nodes will run only on the 2 slave nodes. Please view Figure 3 above for the cluster setup details. 

                        Slaves file:

                        10.75.31.5
                        10.89.4.229

                        4) The last step before testing the installation is to format the file system on the namenode which will run on the master node in this setup scenario which can be performed by executing the command:

                        HADOOP_HOME/bin/hadoop -format namenode

                        Testing and Monitoring
                        The final and most important part is to test the newly created Hadoop cluster by running a sample mapreduce project and verify all Hadoop components are running and can execute MR jobs successfully.

                        Firstly, we should execute the following commands on the master node to start the namenode, datanodes, node managers and job history server to track and view job status.

                        The namenode will run only on the master in our test setup and is started by executing the following command:

                        $HADOOP_HOME/sbin/hadoop-daemon.sh start namenode

                        Start the datanodes which will run on both the slave nodes:

                        $HADOOP_HOME/hadoop-daemons.sh start datanode

                        The resource manager process will run only on the master and is started using the following command:

                        $HADOOP_HOME/yarn-daemon.sh start resourcemanager

                        The node manager process runs on each of the slave nodes and is started using this command.:

                        $HADOOP_HOME/yarn-daemons.sh start nodemanager

                        The job history server process runs on the master node and is started using the following command:

                        $HADOOP_HOME/mr-jobhistory-daemon.sh start historyserver


                        To verify all processes are running, execute the jps command on each cluster node and check the log files for possible issues. Log Files for the namenode, resource manager, datanodes, nodemanager and job history are located in the directory $HADOOP_HOME/logs on the relevant node.

                        A list of the Hadoop processes running on each node is represented in Figure 3.

                        We will now execute the infamous wordcount mapreduce job which is bundled as a sample on Hadoop 2.4. However, firstly we need to create a directory with a sample file on the master node and copy this directory to DFS.

                        1) On the master node, create a directory named "sampleinput" and place a sample text file into this directory. 
                        2) Copy this directory to DFS by executing the command: bin/hadoop dfs -copyFromLocal sampleinput /sampleinput

                        Now we execute the wordcount sample by executing this command which will copy the results to the directory named "sampleoutput".

                        $HADOOP_HOMEbin/hadoop jar share/hadoop/mapreduce/hadoop-mapreduce-examples-2.4.0.jar wordcount /sampleinput /sampleoutput

                        You can check the status of the cluster and view job execution details for all jobs which have executed by navigating to the resource manager and job history web consoles at http:<master_ip>:8088/cluster and http://<master_ip>::19888/jobhistory respectively.


                        Figure 5: Cluster status overview


                        Figure 6: Job History Overview

                        Next Steps
                        In the next blog in this series, we will provide an overview and explore some of the API's available in the Apache Spark framework. Apache Spark is an in-memory distributed processing framework which provides very useful API's for processing streamed data, data residing on Hive and a machine learning framework to perform complex machine learning operations on large datasets. Apache Spark can also interoperate with data residing on HDFS.


                        Resources
                        1) http://hadoop.apache.org

                        2) http://hortonworks.com/blog/apache-hadoop-yarn-background-and-an-overview/


                        MIDDLEWARE INSIGHT - C2B2 Newsletter Issue 16

                        $
                        0
                        0
                                    

                        Featured News

                        Tomcat Performance Monitoring & Tuning - read more
                        Processing on the Grid - read more


                        JAVA / OPEN SOURCE

                        GlassFish

                        Building GlassFish from Source, read the blog post by Andy Pielage   
                        David Heffelfinger's Java EE/GlassFish Adoption Story, read more on The Aquarium 
                        GlassFish Community Q&A with Reza Rahman including GlassFish Roadmap overview, join the online event on the 30th of May

                        Tomcat

                        How to set up a cluster with Tomcat 8, Apache and mod_jk ,read more on the C2B2 Blog 
                        Configuring Tomcat 8, find out more 
                        Apache Tomcat 8 Preview, watch the webinar here
                        Hooking Up HTTPSessionListener with Tomcat, read more on DZone

                        Other
                        Common Middleware Problems, read more on the C2B2 website
                        Mobile infrastructure: Can middleware bridge the mobility gap?, read more on SearchSOA
                        Java EE: The Basics, read more on DZone
                        ActiveMQ and HawtIO, read the article by Dejan Bosanac
                        Chronicle and low latency in Java, read more on the Vanilla Java Blog
                        Java+EE Basic Training with Yakov Fain By Reza Rahman, watch the video here
                        Crack the Raspberry Pi. Win a JavaOne Trip!, find out more
                        Devoxx UK - 12 & 13 June 2014 - see the programme & get your tickets here
                        JAX London 2014,programme is now online, C2B2 are speaking- find out more & get your tickets here

                        ORACLE

                        Oracle v. Google, A Mitigated Disaster, read more on DZone
                        What does the Google versus Oracle decision actually mean?, read more on Jaxenter.com
                        Java ME 8 Arrives, read more on the Oracle Blog
                        The JavaOne Java EE Track: Thanks, a Sneak Peek and an Invitation, read more on the Oracle Blog
                        WebLogic and Fusion Middleware Configuration Management using Chef and Puppet - watch the webcast on demand here
                        How to Start the WebLogic Server in Debug Mode, read more on Mohan Kandra's Blog
                        Oracle scaling out to NoSQL domination? Read more on Jaxenter.com
                        JSONB and security simplification top wish list for Java EE 8, read the article on Jaxenter.com
                        Java 8 isn't all rainbows and sunshine. Here are a few pet peeves, read more on The Server Side
                        Retrieving WebLogic Server Name and Port in ADF Application, read more on Andrejus Baranovski's Blog 

                        JBOSS & RED HAT

                        WildFly 8.1 CR2 is released. Download here
                        Getting Started with WildFly in OpenShift and JBoss Developer Studio, read more on the WildFly blog
                        PicketLink 2.6.0.CR2 is out! ,read more here
                        PicketLink: Simplified Security and Identity Management for Java, read more on Arun Gupta's blog
                        Red Hat To Bring Docker Support To Enterprise Linux And OpenShift, read more on TechCrunch
                        London JBUG May Event - Hack on WildFly 8, 21st of May, find out more & register here
                        Red Hat expands cloudy arsenal with Inktank swoop, read more on Jaxenter.com
                        Red Hat Hybrid Cloud Programme lead on why it's good to resist definition, read more on Jaxenter.com
                        “If you are currently using AS7, then you should really check out WildFly”, read the article by Bernhard Löwenstein
                        Building The JBoss BRMS Cool Store Demo (Introduction & Labs 1 - 2), read more on DZone
                        WildFly System V Initial Script, read the article by Peter Pilgrim
                        JBoss Fuse iPaaS on OpenShift, read more on DZone

                        Contract First Web Service Integration with Apache Camel on JBoss EAP, read the article by Christian Posta

                         DATA GRIDS & BIG DATA

                        Hadoop v2 overview and cluster setup on Amazon EC2, read more on the C2B2 Blog"2014 will be big for off-heap stuff": A walk down the Hazelcast roadmap, watch the video here
                        All in the concurrency: Hazelcast talk Java 8, find out more here
                        Scaling for Big Data: An introduction, read more on Jaxenter.com
                        Build, Install and Configure Eclipse Plugin for Apache Hadoop 2.2.0, read the article by Abhijit Ghosh
                        Which data governance best practices optimally handle a storm of data? Read more on SearchSOA
                        Hadoop, Big Data and Data Warehouse: Friends, Enemies or Profiteers? Read more on DZone
                        The future of Big Data is linked to Cloud, read the article by Maareten Ectors
                        ‘Detecting the Malicious Insider’-C2B2 wins the Technology Strategy Board Launchpad Competition, read more here

                        Getting the most out of WLDF Part 3: Notifications

                        $
                        0
                        0
                        Read Part 1: "What is the WLDF?" here
                        Read Part 2: "Watches" here

                        This blog directly follows on from part 2 on watches, so if you haven’t already read that then you should probably go and do that now.

                        You can still create notifications without having any watches configured; you just won’t receive anything on them.

                        In the last post, I had created two watches, one Server Log watch and one Collected Metrics watch. In this post, I will create notifications to work with these watches.


                        What are notifications?
                        WLDF notifications are nothing more than a particular configuration for alerting based on a condition. Think of them as channels of communication; unless something is sent down those channels, they will stay empty. The forms that these channels can take are:
                        • SMTP Email
                        • JMS Message
                        • Diagnostic Image
                        • JMX Notification
                        • SNMP Trap

                        Which notification should I use?
                        There’s no right or wrong when it comes to choosing notification methods, but there is certainly annoying and non-annoying! Of the notification methods above, all but email are passive methods of alerting people concerned. The reason I classify them as passive is that you, as the end-user who wants to be notified, must perform some sort of action to consume that notification. For example, to consume JMS message data, you must use a JMS client and would likely process the data automatically, perhaps for graphing.

                        Email, in contrast, is an active method of alerting since the end user will be told when she gets a new email. The majority of smartphone equipped techy people will check their email because their phone has beeped at them, not because they were simply curious. If you find yourself staring out of a rainy window wondering at what treasures your inbox might hold, you likely have bigger problems than configuring WLDF.

                        So which is best: active or passive?

                        Well you want to be ahead of the curve with what’s happening in your environment, don’t you? So email it is! Decision made, then, off you go and configure WLDF to send emails for every time a watch is configured.

                        I’ll wait here.

                        Done?

                        How did that go down with your support team? Badly? I thought so.

                        The problem with just using a single notification method for every watch event is that you definitely want to be notified as soon as some critical event occurs that requires action, but what if the event is only medium or low priority, or can be recovered from automatically? In those cases, you absolutely don’t care about every single event and often you’d like a lot of data to be graphed for you to review at a later date, which email is certainly not built for.

                        As the signal to noise ratio goes down, you’ll find your support users increasingly set up rules to ignore alerts and you find yourself in the same position as before when something critical happens where no-one takes any notice because they’re ignoring all your usage results.

                        I’ll outline two different notification types here, though they are all straightforward to configure.

                        JMX Notification
                        To create your JMX notification, go to the diagnostic module where your watches are configured. In Configuration -> Watches and Notifications, click the “New” button in the Notifications tab in the lower pane. 

                        Next, there are just two steps. Select “JMX Notification” as the type, as shown in the image, then click Next to name your notification.

                        Enter a meaningful name in the name field and make sure the Enable Notification box is ticked. Click OK and your notification is created!

                        Email notification
                        In the same way as before, click the “New” button in the Notifications tab of the appropriate diagnostic module.
                        After selecting the type as SMTP email and giving it a meaningful name, click next to complete the final step


                        Choose the mail session you want to use, enter email addresses you want to alert with this notification and click finish.
                        If you haven’t already created a mail session, you can use the button here to make one without losing your place. This is a blog about WLDF not Java mail, so I won’t go into that, but they are simple enough to be described with a single page of documentation.

                        Using your notifications
                        Now you’ve created your notifications, you need to tell your watches to use them! In the screenshot below, I’ve opened my SocketsOpen watch from the last blog and moved across my JMX notification from “Available” to “Chosen”


                        That’s all there is to it! Obviously if you wanted to use the email notification, choose that instead or as well as the JMX notification.

                        It’s pretty obvious how the email notifications work – check your inbox. If you were to fire up JConsole to check your new MBean, however, you would find that you can’t access it. The reason for that is that you need to add the right WebLogic jar to the classpath before you start JConsole.

                        To demonstrate the JMX notification working, I used a single Java class that I stumbled across, and modified slightly, from an Oracle blog. Make sure to include weblogic.jar from the server/lib directory of your WebLogic installation in the classpath if running in the command line or the project build path as in my screenshot of Netbeans below:


                        What next?
                        Now you can create watches and notifications on WebLogic, you can configure a monitoring product like RHQ or Hyperic to monitor anything that you can configure a watch on; with JMX tools, this normally stops with MBeans, but thanks to watches you can also monitor server logs and instrument your applications!


                        | View Mike Croft's profile on LinkedIn | Mike CroftonGoogle+

                        Configuring JBoss Management authentication with LDAP over SSL

                        $
                        0
                        0

                        Overview

                        In this blog, we will discuss how to set up a JBoss domain controller node and slave host node to allow users stored on LDAP server to authenticate against the JBoss Http and native management interfaces. Users will be authenticated using LDAP over SSL. We will demonstrate this for users stored on both OpenLDAP using 1 way SSL whereby the JBoss server verifies the identity of the LDAP server host.

                        Software Prerequisites

                        We used the following software during this test setup:

                        1. OpenLDAP-2.4.39 (windows)
                        2. JBoss 6.1.1
                        3. JDK Hotspot 1.7.0_51
                        4 (Optional LDAP Browser tool) JXplorer

                        Test Topology

                        In this blog, we will not discuss the details on how to use OpenSSL or the JDK keytool utilities to generate new certificates, to create a new keystore or to import certificates into the keystore we use. The principal focus is on how to configure JBoss cluster nodes to authenticate users stored in an external LDAP directory whereby communication between the JBoss Domain Controller and the LDAP server is over SSL.

                        Figure 1
                        In Figure 1, we provide a broad overview of the test environment used. The environment consists of a 2 node JBoss cluster whereby the domain and host controller are on different host machines and there is another host machine in this environment which runs the OpenLDAP user repository. 

                        SSL and Certificate Generation


                        In the test setup above, we used the OpenSSL and the JDK keytool utility to do the following:

                        1. Generate a new self-signed certificate using OpenSSL. We should ensure the common name (CN) matches the host name of the machine the LDAP server resides on.
                        2. Configure OpenLDAP to use the new certificate. This can be done either by using JXplorer or by modifying the OpenLDAP server configuration file (slapd.conf) like below where ldapserver.pem is the name of the new certificate:

                         TLSCertificateFile ./secure/certs/ldapserver.pem  
                        TLSCertificateKeyFile ./secure/certs/ldapserver.pem
                        TLSCACertificateFile ./secure/certs/ldapserver.pem

                        3. Create a new keystore which will be used by the JBoss domain controller node and import the self signed certificate from step 1 above into the new keystore to be used by JBoss. The keystore used by the JBoss domain controller node is held in the directory <JBOSS_HOME>/domain/configuration/client.keystore

                        4. Add a new user to the directory server with these credentials:
                        username: uid=davew, ou=People,dc=maxcrc,dc=com
                        password: password


                        Now that the LDAP server has been configured to use the new certificate and the keystore has been setup for use by the domain Controller node, we will now setup both JBoss nodes in the cluster to authenticate against user in the LDAP directory over SSL.

                        JBoss Configuration


                        There are a number of steps which we must perform to configure both the domain controller and remote host controller nodes to communicate with the LDAP server over SSL. We will now discuss each.

                        Domain Controller Setup

                        There are 4 main configuration steps which we must perform to setup the domain controller node to authenticate against the LDAP server over SSL. All these steps are performed in the host controller configuration file (in this case host.xml) residing on the domain controller node.

                        1. Setup a new security realm in the host.xml configuration file  and configure the realm and in particular the authentication element with a new LDAP connection name, base-dn which points to the path/directory where users are held and user id attribute so that when a search is performed using a user with search privileges on the directory server, users will be searched using the directory server uid attribute :
                        <security-realm name="LdapSSLConnection">  
                        <authentication>
                        <ldap connection="ldapremote" base-dn="ou=People,dc=maxcrc,dc=com" recursive="true"> <username-filter attribute="uid"/>
                        </ldap>
                        </authentication>
                        </security-realm>

                        2. Create a new outbound connection whereby we provide details on the host and SSL port the LDAP server is listening on along with the credentials of the user who has permission to search the directory server as below. In this case, the user cn=Manager,dc=maxcrc,dc=com has administrative permissions to perform searches.

                        <outbound-connections>  
                        <ldap name="ldapremote" url="ldaps://dwinters-pc:636" searchdn="cn=Manager,dc=maxcrc,dc=com" search-credential="secret"/>
                        </outbound-connections>

                        3. We now need to configure the native and http management interfaces to use the new LDAP security realm.
                        <management-interfaces>  
                        <native-interface security-realm="LdapSSLConnection">
                        <socket interface="management" port="${jboss.management.native.port:9999}"/>
                        </native-interface>
                        <http-interface security-realm="LdapSSLConnection">
                        <socket interface="management" port="${jboss.management.http.port:9990}"/>
                        </http-interface>
                        </management-interfaces>

                        4. The last step is to configure each server running on the domain controller node with the location of the truststore and the password. We do so by providing these details via the system-properties element on each server.

                        <server name="server-one" group="main-server-group">  
                        <system-properties>
                        <property name="javax.net.ssl.trustStore" value="C:\Users\dwinters\Downloads\jboss-eap-6.1\jboss-eap-6.1\domain\configuration\client.keystore"/>
                        <property name="javax.net.ssl.trustStorePassword" value="password"/>
                        </system-properties>
                        </server>

                        Remote Host Controller

                        There is no special configuration needed on the remote controller node. Since access to the management interfaces is performed on the domain controller node, we just need to specify in the host controller configuration file (host.xml) the address of the domain controller of the cluster and the encryted password of an authenticated LDAP user via the server-identities element so that this node can register successfully with the domain controller as below:

                        <domain-controller>  
                        <remote host="${jboss.domain.master.address:<remote_host_name>" port="${jboss.domain.master.port:9999}" security-realm="ManagementRealmNative" username="davew"/>
                        </domain-controller>

                        <server-identities>  
                        <secret value="<encryptedpassword>"/>
                        </server-identities>

                        Testing 

                        We will now attempt to login on the domain controller node to the management administration console and using the jboss CLI tool using the details of a user stored on the LDAP server. In the Figures below, we can observe that when we navigate to the management console on http://<hostname>:9990/console, we are prompted for the LDAP user details and also when we login to the jboss CLI tool we are once again prompted for the username and password.


                        If you encounter any issues while authenticating users and wish to debug exceptions further, it is very useful to switch on debug logging on the Java SSL packages which will provide details on where the connection is failing between the JBoss server and LDAP server, whether this be a failure to negotiate a common cipher suite between the jboss server and LDAP server or otherwise. To turn on debug logging, set this Java command line property in the domain.conf file on the domain controller node:

                         -Djavax.net.debug=all  

                        Next steps

                        We could further extend the JBoss configuration above to use its vault utility so that plain text passwords which are in the domain controller configuration files are stored in a password keystore hosted on the domain controller node. The setup and use of vault is quite straightforward and provides an extra layer of security to store sensitive details. 


                        Building RHQ to Monitor WildFly

                        $
                        0
                        0

                        Introduction  

                        The logo of RHQMonitoring tools, such as RHQ, are a useful and sometimes integral part of a software system, providing insight into the mysterious happenings of our computers and the software running on them. Their usefulness however, is limited by the products and metrics that they can monitor.

                        As RHQ currently stands (4.11), it cannot monitor WildFly due to a plugin error; the plugin would fail to correctly check the product name, default to JBoss AS, and refuse to monitor the app server due to the discrepancy. The kind folks who contribute to the RHQ project have implemented a fix for this in the master build available on GitHub (see here), so if you’re gnawing at the bit to monitor some WildFly and can’t wait for the next release, you’re in luck.


                        Building RHQ 

                        Building RHQ from source is no more difficult than building GlassFish from source, in fact the steps are pretty much the same. I’ll be walking you through the build, but if you want, you can read the official guide.

                        As a side note, I'm assuming that you already have Git, Maven, PostgreSQL, and JDK 7 installed, as all of these are required! If you don't have them installed, I would go install them now before attempting to continue with this guide; you'll be making it needlessly difficult for yourself otherwise!

                        Configuring Maven

                        To ensure the build is successful, you must set some environment variables for Maven; if you don’t set them, the default settings will likely cause the build to fail after about 50 minutes with an “out of memory” error, and you will have to start again (am I bitter? Slightly).

                        The environment variables to set are:
                        • MAVEN_HOME=$where_you_installed_it
                        • MAVEN_OPTS=“-Xms256M –Xmx768M –XX:PermSize=128M –XX:MaxPermSize=256M”
                        • PATH=$PATH:$MAVEN_HOME/bin
                        You will also need to provide Maven with a settings file. The RHQ team have provided a default one that meets our basic setup needs.

                        Once you have downloaded this file, place it in the $HOME/.m2 directory (note: most GNU/Linux distributions hide files or directories beginning with a full-stop by default). $HOME refers to your actual home directory here (e.g. /home/user/.m2 on a Linux system), not the Maven home.

                        Configuring PostgreSQL

                        When installing the RHQ binaries, a database named rhq and a user named rhqadmin are required; building RHQ from source also requires another database be created, rhqdev. Run the following commands to create them:
                         CREATE DATABASE rhq;  
                        CREATE DATABASE rhqdev;
                        CREATE USER rhqadmin WITH PASSWORD ‘rhqadmin’;
                        GRANT ALL PRIVILEGES ON DATABASE rhq to rhqadmin;
                        GRANT ALL PRIVILEGES ON DATABASE rhqdev to rhqadmin;

                        Get RHQ

                        With the pre-configuration tasks done, we can now move on to getting and building RHQ. As previously noted, the RHQ master branch is publicly hosted on GitHub, allowing us to clone the repository to our own machines. Clone the master branch with this command:
                         git clone https://github.com/rhq-project/rhq.git   
                        This will create a directory called rhq in the directory the command is called from and place the repository inside of it, so try and make sure you call it from where you want it to be downloaded to.

                        Building and starting RHQ

                        Finally, we can begin building RHQ! Be warned though; as hinted at earlier, the build can take around an hour to complete, so you may want to go and eat lunch whilst Maven downloads dependencies for about 5 times as long as it takes to just download RHQ.

                        Navigate into the rhq directory that you just downloaded, and invoke this command:
                         mvn -Penterprise,dev -Ddbsetup -DskipTests install   
                        At this point, I recommend leaving Maven to build RHQ, and going to do something constructive yourself. Don’t worry, you can trust Maven to not rampage through your computer.

                        Once Maven has finished, you can find the start commands in $where_you_downloaded_rhq/rhq/dev-container/rhq-server/bin, and start the server as if you’d just downloaded the binaries with the rhqctl start command.

                        Setting up and Starting WildFly

                        Now that we have RHQ up and ready to go, we need to give it a WildFly instance to monitor. We’ll go with a fresh install of WildFly to navigate around any strange configuration foibles that may exist in a pre-existing installation, so download WildFly and extract it to where you want it installed. Navigate into its bin directory once it has been extracted and run the add-user script, following the prompts to create a management user for you to use (I’ll be calling mine admin because I’m original). Once you’re done with that, start the app server with the standalone script (also located in the bin directory).

                        Configuring RHQ to Monitor WildFly

                        The final steps! When you start RHQ, WildFly will not instantly be available in the inventory; we must wait for the agent to locate it and then manually add it to our inventory. To do so, click on the Inventory dropdown arrow and select Discovery Queue. From here, expand the localhost resource and check the box next to the WildFly app server before clicking Import. If the agent has not located the WildFly server yet, import the agent into your Inventory (the same way as described for WildFly), right click it, select Execute Prompt Command under Operations, and enter discovery -f. Alternatively, just restart the agent; agents perform a discovery scan when they are started. Refresh the Inventory page and WildFly should be there.

                        With WildFly imported, click on the Servers link in the Resources pane to get a list of the servers being monitored. You should see our WildFly server here, though it will not be listed as available since we haven’t finished configuring RHQ yet. Click on WildFly to be taken to its main page, and select the Inventory tab to get a list of all the components it has. From this tab, click on Connection Settings, and you should notice that the password field is blank.


                        Enter the password you chose when creating the admin user for WildFly (also edit the user if it doesn’t match the one you chose), and save your changes. If the stars have aligned in your favour, RHQ should begin to monitor WildFly!

                        Wrapping Up

                        Well done! You are ahead of the trend and are monitoring WildFly with your own personally built RHQ instance (Maven gets no credit). If you’re new to RHQ, poke around the Monitoring tab to see all of the metrics being collected and configure how often they will update. If you aren’t new to RHQ, well you know what to do!

                        Feel free to check out some of our other blog posts on WildFly and RHQ, such as our overview of the new features in WildFly 8, or how to monitor JBoss Data Grid with JON (RHQ).

                        A Strong GlassFish

                        $
                        0
                        0
                        Last November after the announcement by Oracle that no future release beyond the 3.x version of GlassFish would have support from Oracle there were a lot of doom and gloom articles about GlassFish. I tried to put my view that this probably wasn't the end of GlassFish but time would tell.

                        Why we need a Strong GlassFish

                        As the founder of a company that is vendor independent. I think it is imperative for the Java EE community that there is a strong vibrant GlassFish server. Having GlassFish out there as a viable production open source Java EE server drives competition. Competition drives innovation in competing products. Competition drives quality in competing products. Competition drives adoption through visibility and choice. If GlassFish fades then I'm afraid that the whole of Java EE fades. There will be no competitive incentive to drive innovation in WildFly, although I'm sure the RedHat engineers wouldn't consciously drive down innovation and quality but competition naturally keeps them lean, mean and fast. If GlassFish in the future fails to deliver a good out of the box experience for Java EE 8 and beyond due to poor quality or poor performance then future Java EE adoption as a whole is threatened. This threatens Oracle WebLogic, RedHat JBoss EAP, IBM WebSphere sales as where are the developers to choose the big beasts for production?


                        Optimism for the Future

                        Over 6 months have passed and I've been trying to take stock of where we are. I've recently hosted a community Community Q&A session with Reza Rahman and the London GlassFish User Group and  organised a BOF at Devoxx UK with David Delabassee to get the community involved in what is happening with GlassFish. We've watched the code archives and started our own builds

                        After these events, I'm heartened and optimistic that GlassFish is here to stay. After an initial downturn in activity it seems Oracle are starting to get their act in gear and understand why GlassFish can not fade or become a toy. They have now announced a bug fix release of GlassFish to include JDK 8 certifications and updates to many of the core Java EE component libraries e.g. Tyrus and EclipseLink. Some key points to come out of my discussions with people at Oracle which leave me optimistic are;
                        • Many of the core Java EE libraries will eventually be the core Java EE implementations in WebLogic so will require development and bug fixing.
                        • There is no intention to turn GlassFish into something like the old J2EE SDK
                        • Security fixes to GlassFish are still a priority
                        • GlassFish 5 development to align with Java EE 8 is planned.


                        Feed the Fish!

                        As David Blevins from Tomitribe rightly blogged  open source software is not free and needs community support. It is with this in mind that C2B2, even though we are vendor independent, will be hiring and dedicating some engineers to work on the core GlassFish code base for our support customers. We will also work to mobilise community involvement in GlassFish through Java EE and GlassFish user groups and we are kicking off a BOF at Java One


                        MIDDLEWARE INSIGHT - C2B2 Newsletter Issue 17

                        $
                        0
                        0

                        Featured News

                        A Strong GlassFish - read more
                        Configuring JBoss Management authentication with LDAP over SSL - read more


                        JAVA EE / OPEN SOURCE
                        Java EE 7 birthday special: tutorials, video, festing - read more on Jaxenter.com
                        Java EE 8 update, read more on The Aquarium blog
                        JavaOne Java EE Track Content Finalized (A Detailed Preview) - read more on The AquariumJavaOne Content catalog is live (C2B2 is speaking!) - see more on the Oracle website
                        GlassFish Community Q&A with Reza Rahman, Discussing GlassFish future - watch the video here Newly published Java EE 8 JSR draft shines a light on path ahead - read more on Jaxenter.com
                        From J2EE to Java EE: what has changed? - Read more on the Aquarium blog
                        A Strong GlassFish - read the article by Steve Millidge
                        GlassFish, future and no secret agenda, an interview with John Clingan, GlassFish Product Manager - read more on Adam Bien's BlogMeet Fabric8 and Provisioning Apache Tomcat - read more on DZone
                        Injecting Properties File Values in CDI Using DeltaSpike and Apache TomEE - find out more on GitHub Why Should We Dump Java EE Standard? - read more on Dzone
                        It’s time to make a decision - read more on the Devoxx website 
                        DevoxxUK: Amazing - read more on the Oracle Blog
                        Java EE BoF at DevoxxUK Notes - read more on Arun Gupta’s blog 

                        ORACLE
                        Weblogic Tip #2 - Using Maven to create a WebLogic domain - read more on Java.net
                        Oracle Delivers Latest Release of Oracle Enterprise Manager 12c -read more on the Oracle Blog
                        Getting the most out of WLDF Part 3: Notifications - read the article by Mike Croft Detailed Analysis of a Stuck Weblogic Execute Thread Running JDBC Code - read more on the Oracle Blog 

                        JBOSS & RED HAT
                        Red Hat JBoss BRMS & BPM Suite: Best practices, read more on Jaxenter
                        WildFly 8.1 fully hatched, read the article by Lucy Carey 
                        Building RHQ to Monitor WildFly, read the article by Andy Pielage
                        Configuring JBoss Management authentication with LDAP over SSL by David Winters, read more on the C2B2 Blog WildFly Cluster on Raspberry Pi, read the article by Arun Gupta
                        London JBUG May Event - Hacking on WildFly 9, see the presentations slides here
                        Hibernate Debugging – Finding the origin of a Query, read the article by Aleksey Novik Testing with Aliens: How to test a JPA type converter with Arquillian, read more on the Java Code Geeks website SSL encrypted EJB calls with JBoss AS 7, read the article by Thorben Janssen Putting Java EE in the browser: JBoss web framework Errai at 3.0 status, read more on Jaxenter.com 

                        BIG DATA & CLOUD
                        When it comes to EC2 Instance, what are your options? - read more on Techtarget.com
                        Amazon Machine Images: HVM or PV? - read more on Techtarget.com
                        Attending AWS Summit 2014 in Berlin - read the article by Mikio Braun
                        Affordable performance and scalability with AWS Big Data solutions, read more on The Server Side website
                        C2B2 on G-Cloud - find out more here  Mythbusting: DevOps and Security - read more on DZone.com
                        Using InfiniDB MySQL server with Hadoop cluster for data analytics - read more on Dzone.com Emerging Trends in Big Data Technologies, read more on the InfoQ website

                        What's New in Oracle SOA Suite 12c?

                        $
                        0
                        0


                        Introduction
                        With the recent release of SOA Suite 12c, it seems appropriate to give a quick rundown of some of the new features and improvements made to it from the last release. For those of you who don’t know, SOA Suite is a software collection (or suite, if you prefer) that can be used together to realise a Service-Oriented Architecture.

                        What’s New?
                        Oracle have implemented loads of new features and improvements in this latest release, far more than this blog could reasonably explain, so if you want the full list you can find it in this white paper published by Oracle: What's New in Oracle SOA Suite 12c

                        Read on for an overview of some of the main features…

                        Cloud Integration
                        As with much of the 12c range being released by Oracle, a big push has been made in the Cloud department to keep up with the industry and its current fascination with cloud computing.

                        Cloud Application Adapters
                        In line with this push for greater cloud integration, SOA Suite 12c comes with cloud application adapters. These allow you to more easily connect to and integrate with certain Software-as-a-Service (SaaS) applications housed in the cloud, helping to avoid manually interacting with complex Web Service Description Language (WSDL) interfaces.

                        Cloud Adapter SDK
                        In addition to the new native cloud application adapters, a fully-fledged SDK has been introduced. This helps to standardise and allow SOA Suite integration with SaaS applications that do not have a native adapter included, with Oracle designing their own adapters with it to cement this push for commonality.

                        Mobile Integration
                        To deal with the rise of using smartphones and tablets to access data and apps, Oracle has introduced a REST binding that can be used with SOA composites and Service Bus services. The binding allows you to expose varous services and implementations using JSON and REST, the two standards that are currently dominant for the exposure of services and APIs. The REST binding supports SOAP and XML translation, allowing you to reuse any existing SOAP and XML interfaces, saving many from having to design a new infrastructure to support mobile integration.

                        Internet of Things!
                        With the fast encroachment of the so-called "Internet of Things" into every facet of our lives, Oracle has invested effort into its Event Processing software to deal with the vast amount of data that some of these smart devices can throw out. The most prevalent of these changes are its inclusion into JDeveloper, providing an integrated graphical interface for you to work with (which will be a convenient and welcome solution to some), and Event Delivery Network adapter nodes,
                        providing runtime integration for SOA composites and components.

                        Quick Installer
                        Oracle has introduced a “Quick Start” installer for the new SOA Suite, making the initial installation process quicker and easier than that found in previous releases. Whereas before you had to install each component individually, the new installer installs all of the components of SOA Suite in one single operation; assuming your platform passes all of the prerequisite checks, the only input required from you is to specify where the Oracle Home is going to be (and to press the "install" button).

                        As you can imagine (or have experienced), this is a big improvement over the previous offering.

                        Managed File Transfer
                        With this release of SOA Suite, Oracle has introduced Oracle Managed File Transfer. This product is Oracle's solution to the need for secure file exchange and management, for both internal and external needs. They intend for it to present a single enterprise-wide solution that can scale to accommodate the cloud.

                        JDeveloper Debugging and Testing
                        One of the potentially most useful improvements made to JDeveloper is the inclusion of a debugger, allowing you to set breakpoints within a SOA composite, BPEL process or a Service Bus pipeline. The debugger can also, much like a Java debugger, step into, out, and over the breakpoints, and provides a window displaying all of the variables and their values.

                        The SOA Suite test framework has also been improved, with the ability to run the tests within JDeveloper with detailed reports of every test run, instead of having to perform the testing from within Enterprise Manager Fusion Middleware Control.

                        For many, these could prove invaluable additions. If not invaluable, then at least time saving!

                        Wrapping Up
                        And there you go! A quick overview of some of the features available in the new SOA Suite offering. As I mentioned near the beginning of this blog, there are many more features and improvements that were implemented in this release, such as the new templates, new on-premise adapters, and native XSD enhancements. To save you arduously scrolling back up to find the link, find it here.

                        Feel free to check out some of our other blogs, such as Common SOA Problems, or consider looking into my colleagues' book on SOA Suite 11g Performance Tuning


                        You can also join our half-day Oracle SOA Suite 12c Launch event in London on the 12th of September 2014 - find out more and register here.


                        Processing on the Grid

                        $
                        0
                        0
                        If you ever have the luxury of designing a brand new Java application there are many, new, exciting and unfamiliar technologies to choose from. All the flavours of NoSQL stores; Data Grids; PaaS and IaaS; JEE7; REST; WebSockets; an alphabet soup of opportunity combined with many programming frameworks both on the server side and client side adds up to a tyranny of choice.

                        However, if like me, you have to architect large scale, server-side, Java applications that support many thousands of users then there are a number of requirements that remain constant. The application you design must be high-performance, highly available, scalable and reliable. 

                        It doesn’t matter how fancy your new lovingly crafted JavaScript Web2.0 user interface is, if it is slow or simply not available nobody is going to use it. In this article I will try and demystify one of your choices, the Java Data Grid and show how this technology can meet those constant non-functional requirements while at the same time taking advantage of the latest trends in hardware.

                        Latency: The performance killer


                        When building large scale Java applications the most likely cause of performance problems in your application is latency. Latency is defined as the time delay between requesting an operation, like retrieving some data to process, and the operation occurring. Typical causes of latency in a distributed Java application are:

                        • IO latency pulling data from disk
                        • IO latency pulling data across the network
                        • Resource contention for example a distributed lock
                        • Garbage Collection pauses


                        For example typical ping times across a network range from; 57 μs on a local machine; 300 μs on a local LAN segment through to 100 ms from London to New York. When these ping times are combined
                        with typical network data transfer rates; 25 MB–30 MB/s for 1 Gb Ethernet; 250 MB/s–350 MB/s for 10 Gb Ethernet a careful trade-off between operation frequency and data granularity must be made to achieve acceptable performance. Ie. if you have 100 MB of data to process the decision between making 100 calls across the network each retrieving 1 MB, or 1 call retrieving the full 100 MB will depend on the network topology. Network latency is normally the cause of the developer cry, “It was fast on my machine!” Latency due to disk IO is also a problem, a typical SSD when combined with a SATA 3.0 interface can only deliver data at a sustained data rate of 500–600 MB/s so if you have Gigabytes of data to process disk latency will impact your application performance.

                        The hardware component with the lowest latency is memory, typical main memory bandwidth, ignoring Cache hits, is around 3–5 GB/s and scales with the number of CPUs. If you have 2 processors you will get 10 GB/s and with 4 CPUs 20 GB/s etc. John McCalpin at Virginia maintains a memory benchmark called STREAM (http://www.cs.virginia.edu/stream/) which measures the memory throughput of many computers with some achieving TB/s with large numbers of CPUs. In conclusion:

                        Memory is FAST:And therefore, for high performance, you should process data in memory.
                        Network is SLOW: Therefore for high performance minimise network data transfer. 

                        The question then becomes is it feasible to process many Gigabytes of data in memory? With the costs of memory dropping it is now possible to buy single servers with 1 TB of memory for only a few £30K–£40K and the latest SPARC servers are shipping supporting 32 TB of RAM so Big Memory is here. The other fundamental shift in hardware at the moment is the processing power of single hardware threads is starting to reach a plateau with manufactures moving more into providing CPUs with many cores and many hardware threads. This trend forces us to design our Java applications in a fashion that can utilise the large number of hardware threads appearing in modern chips.
                        Parallel is the Future: For maximum performance and scalability you must support many hardware threads.

                        Data Grids


                        You may wonder what all this has to do with Java Data Grids. Well, Java Data Grids are designed to take advantage of these facts of modern computing and enable you to store many 100 s of GB of Java objects in memory and enable parallel processing of this data for high performance.

                        A Java Data Grid is essentially a distributed key value store where the key space is split across a cluster of JVMs and each Java object stored within the grid has a primary object on one of the JVMs and a secondary copy of the object on a different JVM. These duplicates ensure High Availability as if a single JVM in the grid fails then no Java objects will be lost.

                        The key benefits of the partitioned key space in a Data Grid when compared to fully replicated clustered Cache are that the more JVMs you add the more data you can store and access times for individual keys are independent of the number of JVMs in the grid.

                        For example, if we have 20 JVM nodes in our Grid each with 4 GB of free heap available for the storage of objects then we can store, when taking into account duplicates, 40 GB of Java objects. If we add a further 20 JVM nodes then we can store 80 GB. Access times are constant to read/write objects as the grid will go directly to the JVM which owns the primary key space for the object we require.
                        JSR 107 defines a standards based API to data grids which is very similar to the java.util.Map API as shown in Listing 1. Many Data Grids also make use of Java NIO to store Java objects “off heap” in Java NIO buffers. This has the advantage that we can increase the memory available for storage without increasing the latency from garbage collection pause times.
                         
                        Listing 1
                        public static void main( String[] args )
                        {
                        CacheManager CacheManager = Caching.getCachingProvider().
                        getCacheManager();
                        MutableConfiguration<String, String> config = new MutableConfiguration<String,
                        String>();
                        CacheManager.configureCache("C2B2",config);
                        Cache Cache = CacheManager.getCache("C2B2");
                        Cache.put("Key", "Value");
                        System.out.println(Cache.get("Key"));
                        }


                        Parallel processing on the Grid

                        The problem arises when we store many 10 s of GB of Java objects across the Grid in many JVMs and then want to run some processing across the data set. For example, we may store objects representing hotels and their availability on dates. What happens when we want to run a query like “find all the hotels in Paris with availability on Valentines day 2015”? If we follow the simple Map API approach we would need to run code like that shown in Listing 2.

                        However the problem with this approach, when accessing a Data Grid, is that the objects are distributed according to their keys across a large number of JVMs and every “get” call needs to serialize the object over the network to the requesting JVM. Using the listing above this could pull 10s of GB of data over the network which as we saw earlier is slow.

                        Thankfully most Java Data Grid products allow you to turn the processing on its head and instead of pulling the data over to the code to process they send the code to each of the Grid JVMs hosting the data and execute it in parallel in the local JVMs. As typically the code is very small in size only a few KB of data needs to be sent across the network.

                        Processing is run in parallel across all the JVMs making use of all the CPU cores in parallel. Example code, which runs the Paris query across the Grid, for Oracle Coherence,a popular Data Grid product is shown in Listing 3 and 4.

                        Listing 3 shows the code for a Coherence EntryProcessor which is the code that will be serialized across all the nodes in the data grid.

                        This EntryProcessor will check each hotel as before to see if there is availability for Valentine’s day but unlike in Listing 2 it will do so in each JVM on local in-memory data. JSR107 also has the concept of an EntryProcessor so the approach is common to all Data Grid products.

                        Listing 4 shows the Oracle Coherence code needed to send this processor across the Data Grid to execute in parallel in all the grid JVMs. Processing data using EntryProcessors as shown in Listings 3 and 4 will result in much greater performance on a Data Grid than access via the simple Cache API. As only a small amount of data will be sent across the network and all CPU cores across all the JVMs will be used to process the search.


                        Fast Data: Parallel processing on the Grid

                        As we’ve seen, using a Data Grid in your next application will enable you to store large volumes of Java objects in memory for high performance access in a highly available fashion. This will also give you large scale parallel processing capabilities that utilise all the CPU cores in the Grid to crunch through processing Java objects in parallel. Take a look at Data Grids next time you have a latency problem or you have the luxury of designing a brand new Java application.

                        Listing 2
                        public static void main( String[] args )
                        {
                        CacheManager CacheManager = Caching.getCachingProvider().
                        getCacheManager();
                        MutableConfiguration<String, String> config = new MutableConfiguration<String,
                        String>();
                        CacheManager.configureCache("ParisHotels",config);
                        Cache hotelCache = CacheManager.getCache("ParisHotels");
                        Date valentinesDay = new Date(2015,2,14); // I know it is deprecated
                        for (String hotelName : hotelNames ) {
                        Hotel hotel = (Hotel)hotelCache.get(hotelName);
                        if (hotel.isAvailable(valentinesDay)){
                        System.out.println("Hotel is available" + hotel);
                        }
                        }
                        }
                        Listing 3
                        Public class HotelSearch implements EntryProcessor {
                        HotelSearch(Date availability) {
                        this.availability = availability;
                        }
                        Map processAll(Set hotels) {
                        Map mapResults = new ListMap();
                        for (Entry entry : hotels) {
                        Hotel hotel = (Hotel)entry.getValue();
                        if (hotel.isAvailable(this.availability)) {
                        }
                        }
                        }
                        }

                        Listing 4
                        public static void main( String[] args )
                        {
                        NamedCache hotelCache = CacheFactory.getCache("ParisHotels");
                        Date valentinesDay = new Date(2015,2,14); // I know it is deprecated
                        Map results = hotelCache.processAll((Filter)null, new
                        HotelSearch(valentinesDay);
                        }


                        This article was originally published in JaxMagazine #35 Issue Janauary 2014

                        Viewing all 223 articles
                        Browse latest View live