Overview
There are multiple ways and tools which we can use to monitor JDG including using the JDG Listener API when cache entries are removed and added to specific cachess, exposing the jmx cache statistics however we will focus on using the JBoss Operations Network (JON) to monitor JDG. We will use JON 3.2 and JDG 6.2 in this article. We will use |JON to monitor the distributed Hotrod cache which was deployed to a JDG cluster. The details to set up a JDG cluster which hosts a distributed cache instance can be found here. We will discuss firstly how to setup JON to monitor JDG using the relevant plugins and then demonstrate some of the monitoring capabilities within JON. In this blog, we will use the acronyms RHQ and JON interchangeability as JON is the supported version of RHQ which is open-source.
JON Installation and Configuration
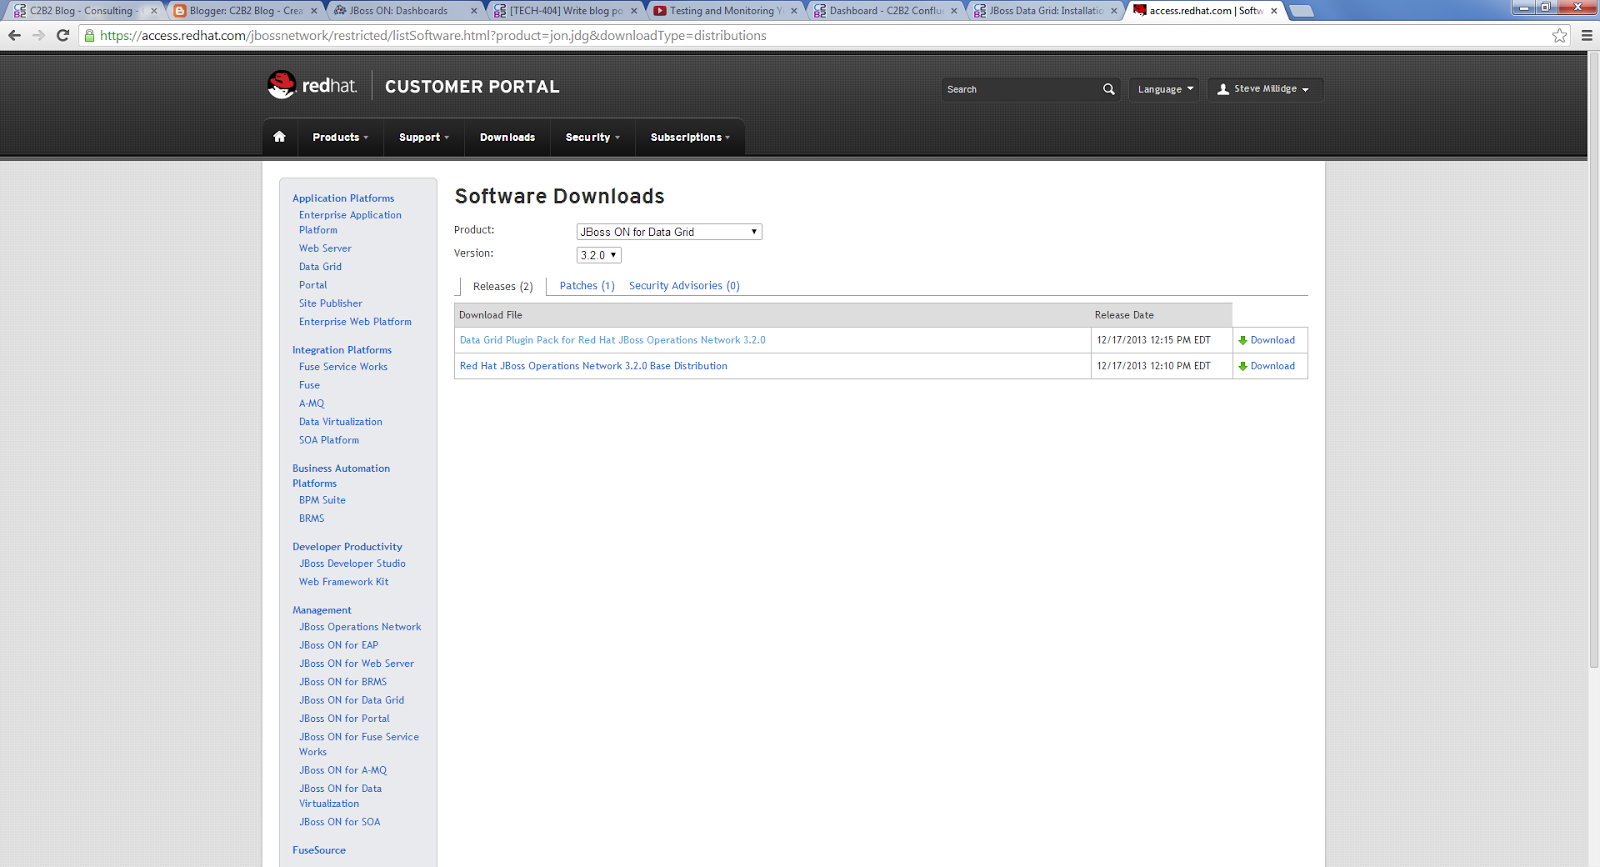
Before installing JON, we need to firstly download JON 3.2 from the Redhat site along with the relevant JON plugins for JDG. We should select "Red Hat JBoss Operations Network 3.2.0 Base Distribution" and the plugin packs to allow for JON to monitor the JDG cluster. The plugin pack names are: "Data Grid Plugin Pack for Red Hat JBoss Operations Network 3.2.0" and "Application Platform Plugin Pack for Red Hat JBoss Operations Network 3.2.0"
![]()
Now that we have downloaded the JON installation package, there are a number of steps which we need to follow to configure JON. JON 3.2 supports Oracle and PostgreSQL as a database backend. We will be using Oracle XE 11.2 to host the RHQ schema objects created at installation time. Furthermore, we have installed JON 3.2 on a single host machine using JDK1.7.0_45. For a list of supported configurations please view this page: https://access.redhat.com/site/articles/112523
We followed these steps to setup and configure JON:
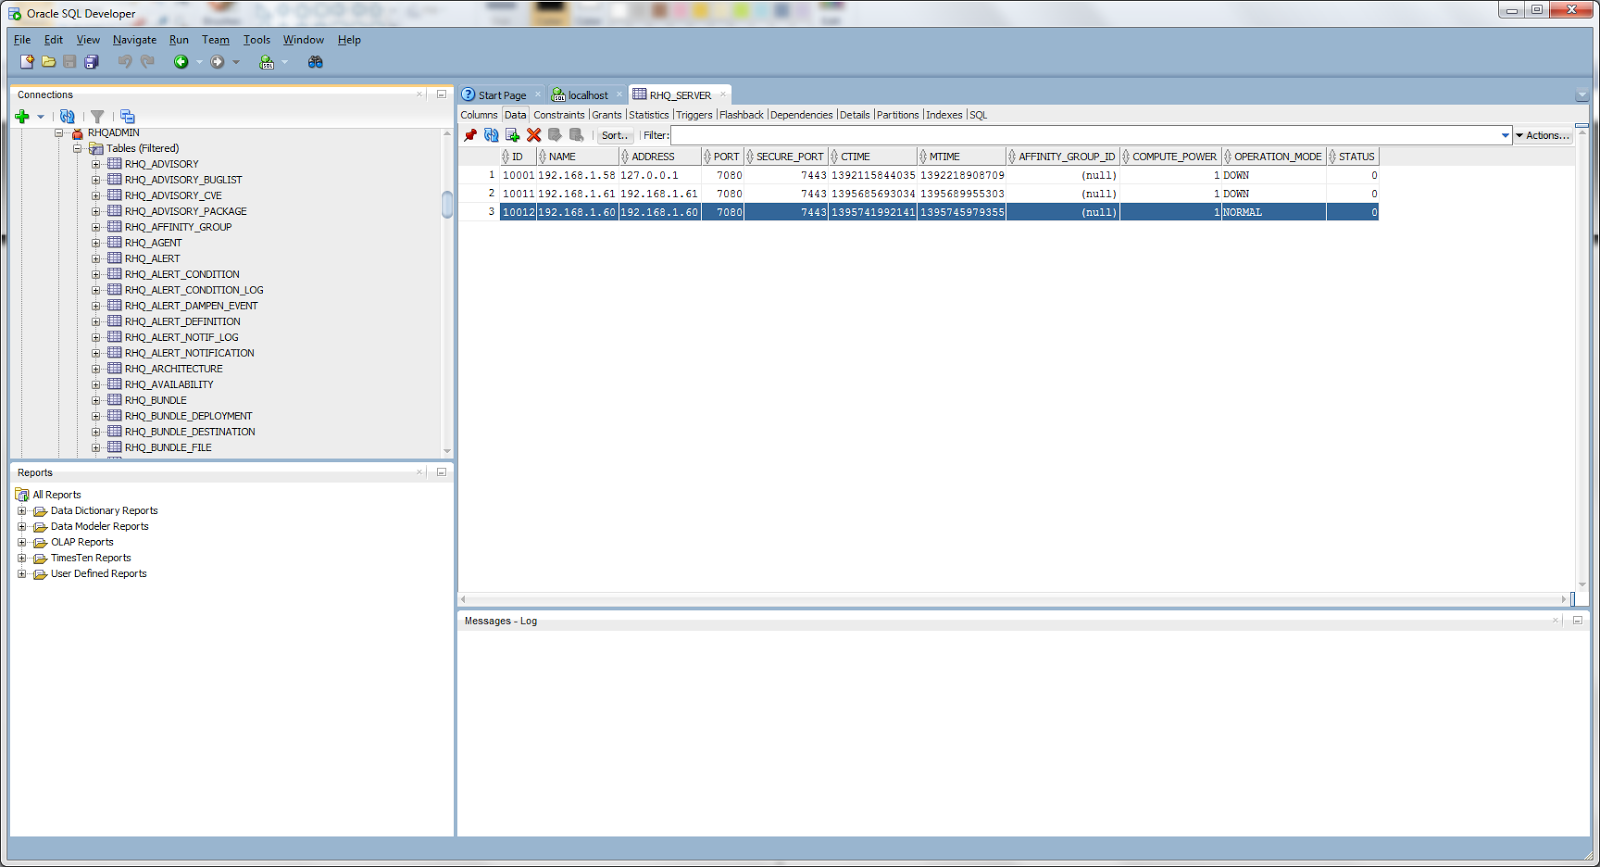
1) Before running the JON installer scripts, we need to setup a user/schema in the Oracle database which will be used to store JON server configuration details and metrics data. I have set up a user named "RHQADMIN" for this purpose.
![]()
2) Unzip the JON installation package we downloaded earlier and configure the JON server properties file named rhq-server.properties located in the <JON_HOME>\bin directory before running the installation script.
3) There are a few notable sections which need to configure in the rhq-server.properties file to configure JON to run on a specific machine and against the Oracle database we preconfigured in step 2 above. These sections are noted below.
a) Provide the name of the database server name, port, database name, username and password where the RHQ schema objects will be hosted. You should provide the encoded user password for the "rhq.server.database.password" property. This is generated using the rhq-encode script located in the <RHQ_SERVER_HOME>/bin directory. For example, below are the configuration details for Oracle XE 11.2.
rhq.server.database.connection-url=jdbc:oracle:thin:@<db_hostname>:1521:xe
rhq.server.database.user-name=rhqadmin
rhq.server.database.password=xxxxxx
rhq.server.database.type-mapping=Oracle11g
rhq.server.database.server-name=unused
rhq.server.database.port=unused
rhq.server.database.db-name=unused
hibernate.dialect=org.hibernate.dialect.Oracle10gDialect
rhq.server.quartz.driverDelegateClass=org.quartz.impl.jdbcjobstore.oracle.OracleDelegate
b) Configure the properties "jboss.bind.address" and "jboss.bind.address.management" to the ip address or hostname were the server will be installed.
c) Configure these 5 installer properties appropriately were the properties "rhq.autoinstall.enabled" and "rhq.autoinstall.database" should be set to "true" and "auto" respectively :
rhq.autoinstall.enabled=true
rhq.autoinstall.database=auto
rhq.autoinstall.public-endpoint-address=<server_ip_address>
rhq.server.management.password=xxxxxx
rhq.storage.nodes=<server_hostname>
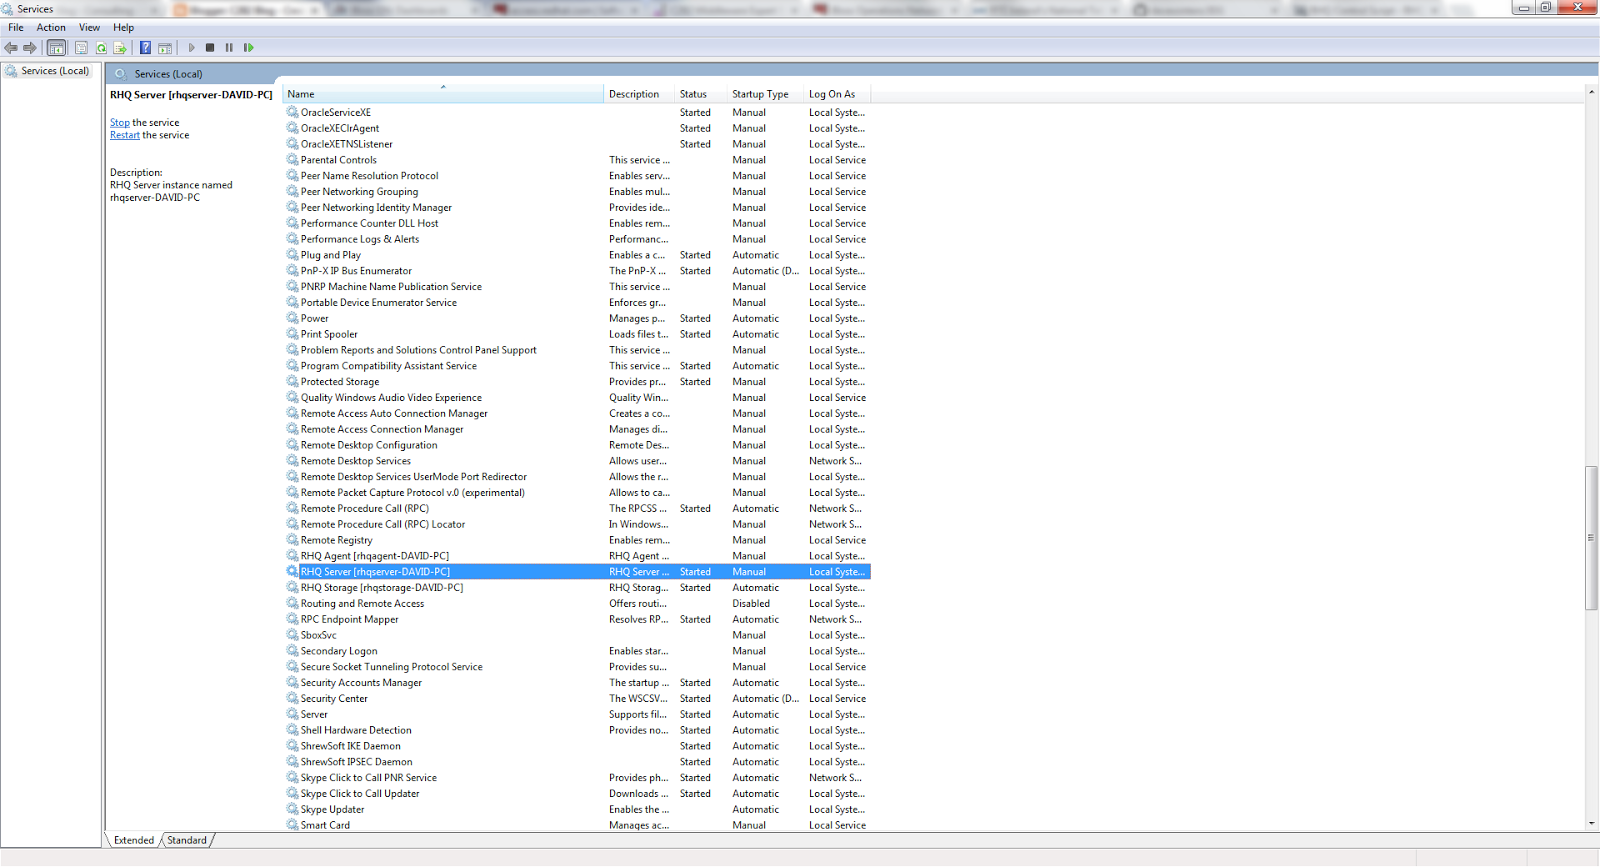
Now that we have configured the rhq-server.properties file, we now need to install the rhq-server, rhq-storage server and rhq-agent. I have installed all 3 on my local windows machine and since I am installing on windows these will be installed as services. To install the 3 JON/RHQ components above, we use the 'rhqctl' command. Execute the command rhqctl install from the console window which will install by default the 3 JON components aforementioned. The installer should take some minutes to install. Once the RHQ Server, storage engine and agent has been installed, we now can start these services using windows services explorer and navigate to http://<server-name>:7080 in the browser window. We should note I have only chosen to start the rhq storage and rhq server service as before we can start the rhq-agent, we firstly need to configure agent which we will discuss in the next section.
![]()
![]()
JON Agent/Plugin Configuration and JDG Instance Detection
The 3 node JDG cluster which we had set up previously referenced here runs on the same machine as the JDG server and the agent which we will now configure. The role of the RHQ agent is to send monitoring updates to the RHQ Server which can be then viewed in the RHQ dashboard console. We need to firstly configure the RHQ agent to the correct RHQ server and also provide the agent with the correct plugin packages to allow for this. The following steps should be completed to achieve this:
1) Open up a console window and navigate to the "bin" directory were RHQ has been installed and execute the batch script rhq-agent. The first time this command is run, the user is prompted for the agent name, agent hostname, server hostname and port. If you need to re-configure the agent at any time execute rhq-agent --fullcleanconfig. Providing the configuration details are correct, the agent should be registered with the RHQ server successfully.
2) The next step to configure the agent is to install the relevant plugins to allow the RHQ server to monitor the running JDG instances via the RHQ agent. We need to install the two plugin packs which we downloaded earlier. We will install these using the RHQ server console however you can also deploy them directly into the RHQ Server plugins directory located at <RHQ_SERVER_HOME>/plugins.
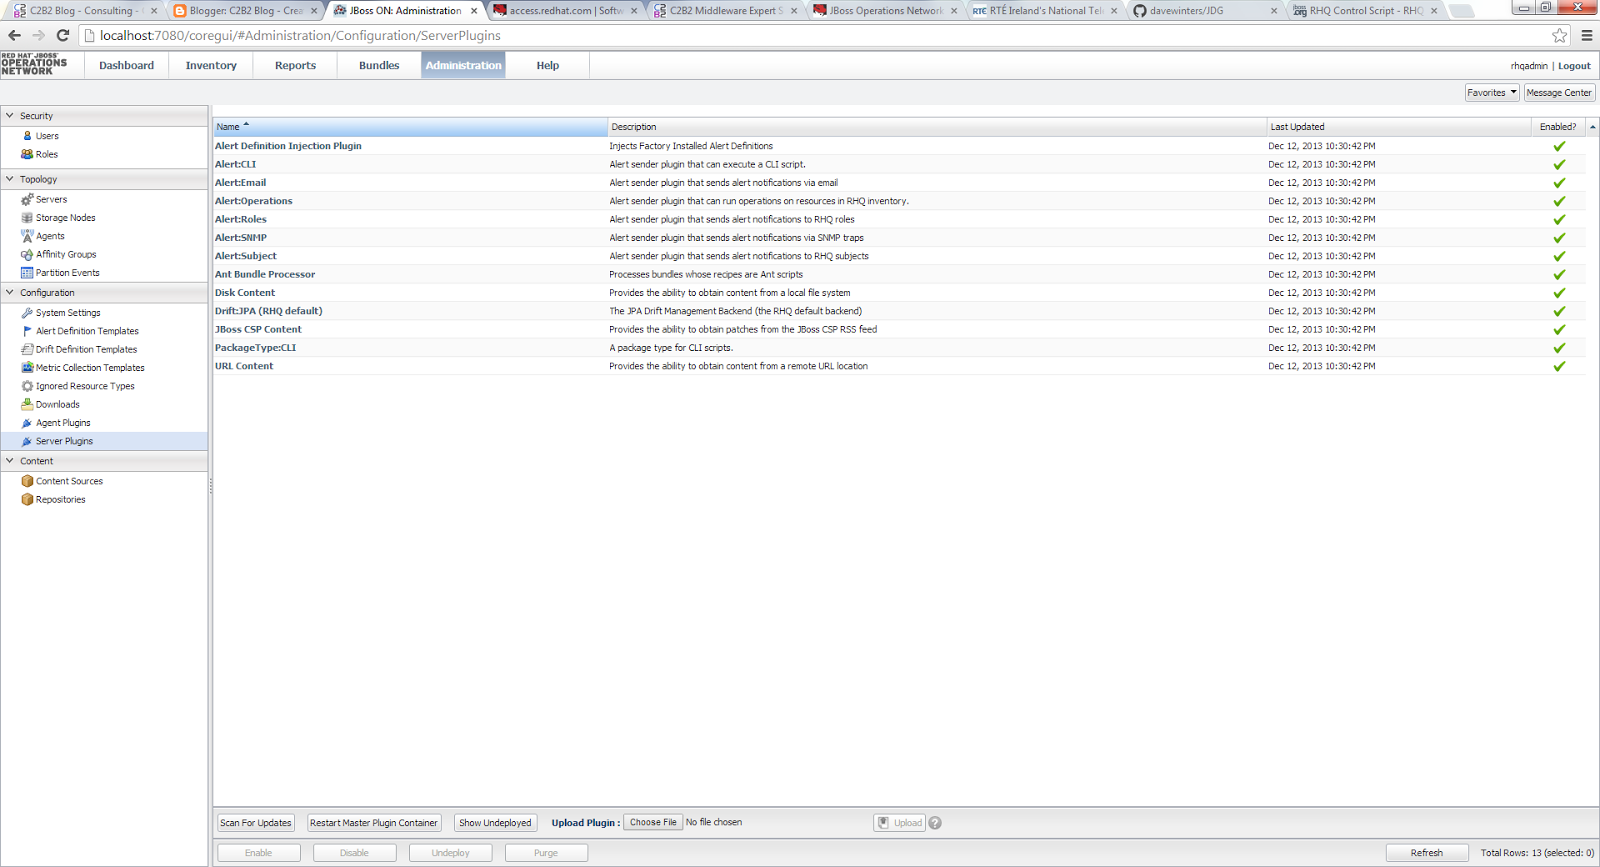
3) To install the two plugins previously mentioned, unzip the two plugin installer zip files into a directory on your file system. Navigate to the "Administration" tab in the RHQ server web console, click on the "server plugin"s menu option and now click on the "choose file" button beside the upload plugin label in this screen. The two plugins have been uploaded to the server and we now want for these plugins to be downloaded to the RHQ agent which can be achieved by either restarting the rhq-agent or by clicking on the "Agent Plugins" menu option and then by pressing the "scan for updates" button which should trigger the copying of the JDG plugins over to the agent "plugins" directory. Providing the agent has been updated with the two previously uploaded plugins, these should be visible in your <RHQ_AGENT_HOME>/plugins directory like in the screenshot below.
![]()
![]()
RHQ Server JDG Resource Configuration and Monitoring Setup
Now that the RHQ server, agent and JDG plugins have bee installed, the last part to setup monitoring of the cache instances running on the JDG cluster is to configure the RHQ Server using the RHQ server web console to indicate what JDG servers we wish to monitor and what monitoring metrics we wish to gather on the distributed cache instance.
To allow the server to detect and monitor the JDG instances, we need to complete the following steps:
1) Start up all JDG instances which we wish to monitor and now navigate to the "Inventory" tab and then click on the menu option named "Discovery Queue" in the RHQ server web console. You should now view the 3 running JDG instances which should be selected before clicking on the "Import" button at the bottom of the screen to import these resources into the RHQ Server configuration for monitoring.
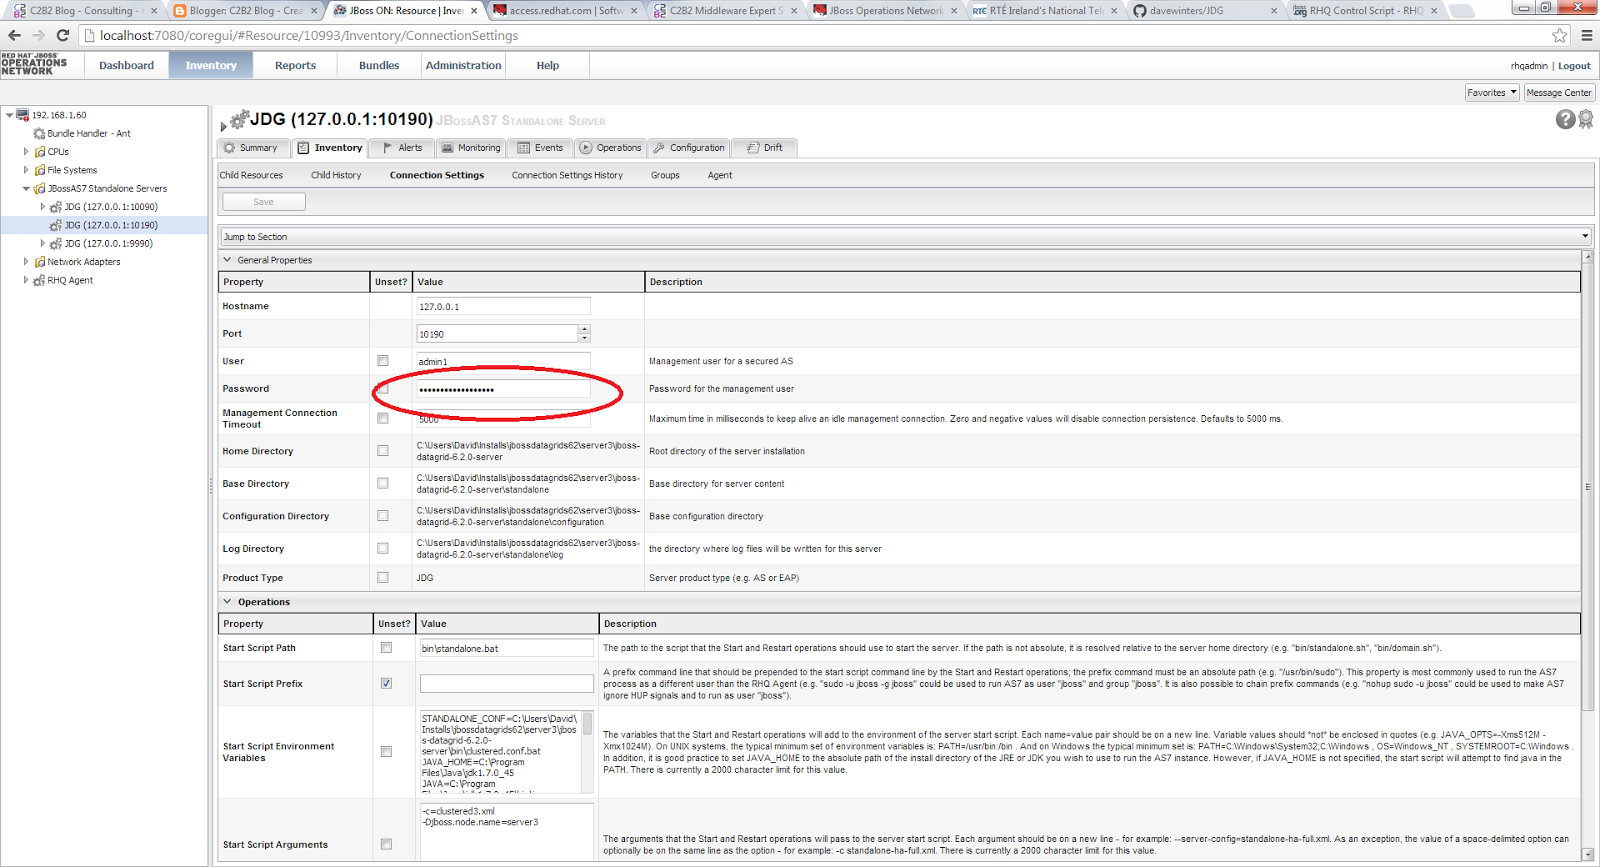
2) Now click the "Servers" menu option in the "Inventory" window and you should be able to view the newly imported JDG instances. We now need to enter the password details for a user configured under management realm for each JDG instance. To set the password, click on each JDG instance then the"Connection Settings" tab.
![]()
Providing there are no issues with the RHQ server and agent configuration details, the server should be marked as available in the "Child Resources" screen under the "Inventory" tab( A Green Tick should be visible under the Availability Column).
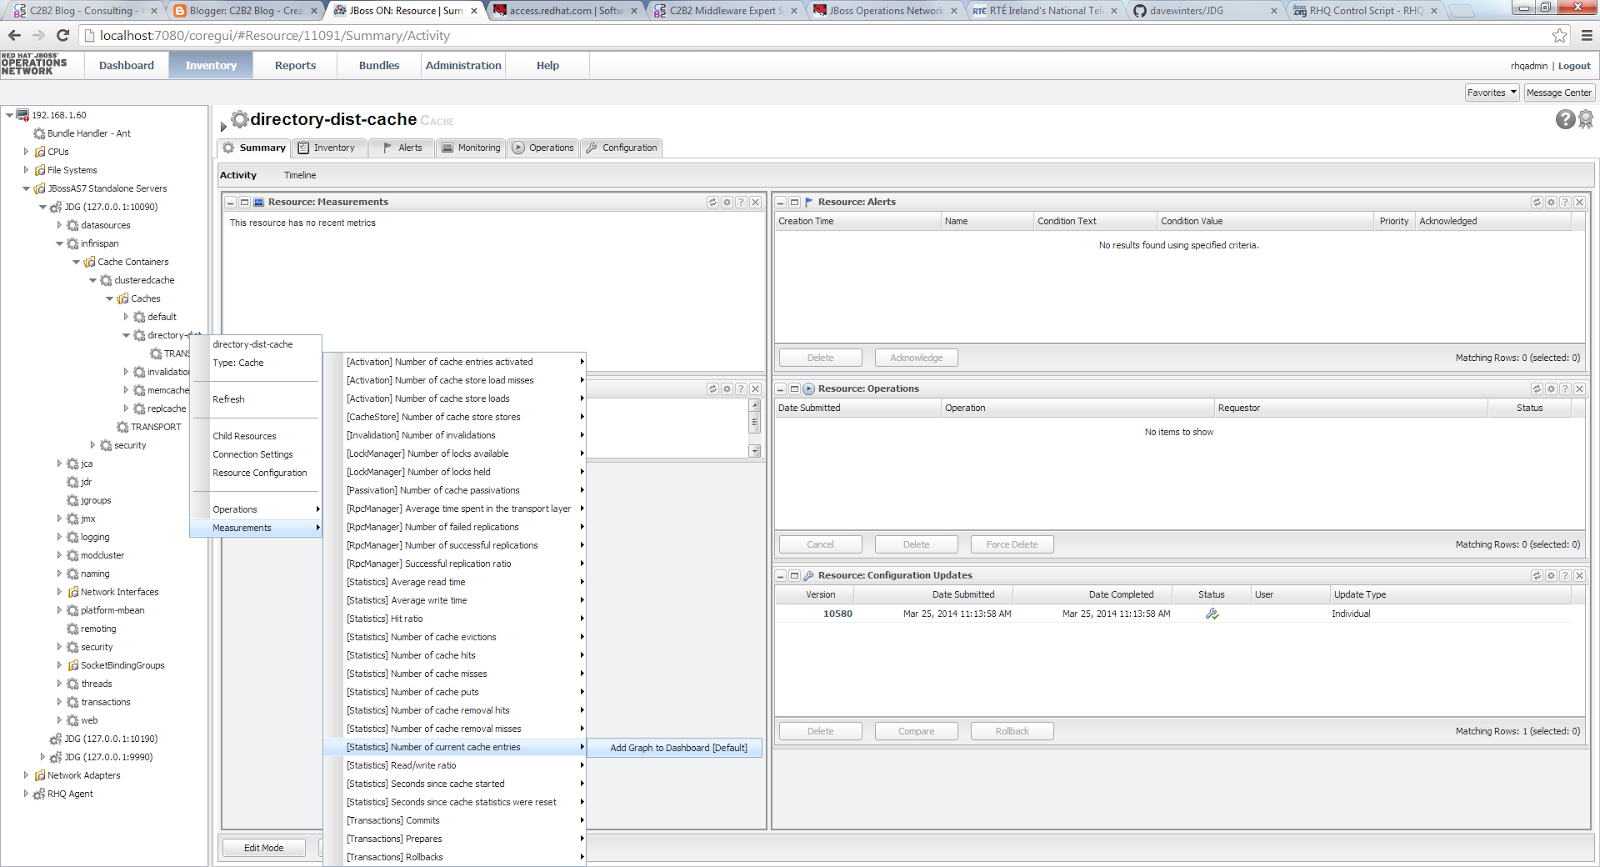
The last part will be to specify what metrics we wish to monitor and to view on either your own dashbaord or just to add to the default dashboard in the RHQ server console. To add new monitoring metrics to the RHQ server dashboard, click on the JDG instance, navigate to the "Child Resources" window, click on the "infinispan" resource and navigate to the cache instance we wish to monitor on the JDG instance. We wish to monitor the distributed cache named "directory-dist-cache" to our JDG cluster as mentioned in the previous blog . Now right click on the cache name and select the "Measurements" dropdown option and we are now presented with a number of cache metrics which we can choose from. We can view an example of various metrics available based on the screenshot below. We are provided with the option here to add these metrics to the default or to are own custom dashboard.
![]()
![]()
There are multiple ways and tools which we can use to monitor JDG including using the JDG Listener API when cache entries are removed and added to specific cachess, exposing the jmx cache statistics however we will focus on using the JBoss Operations Network (JON) to monitor JDG. We will use JON 3.2 and JDG 6.2 in this article. We will use |JON to monitor the distributed Hotrod cache which was deployed to a JDG cluster. The details to set up a JDG cluster which hosts a distributed cache instance can be found here. We will discuss firstly how to setup JON to monitor JDG using the relevant plugins and then demonstrate some of the monitoring capabilities within JON. In this blog, we will use the acronyms RHQ and JON interchangeability as JON is the supported version of RHQ which is open-source.
JON Installation and Configuration
Before installing JON, we need to firstly download JON 3.2 from the Redhat site along with the relevant JON plugins for JDG. We should select "Red Hat JBoss Operations Network 3.2.0 Base Distribution" and the plugin packs to allow for JON to monitor the JDG cluster. The plugin pack names are: "Data Grid Plugin Pack for Red Hat JBoss Operations Network 3.2.0" and "Application Platform Plugin Pack for Red Hat JBoss Operations Network 3.2.0"
Now that we have downloaded the JON installation package, there are a number of steps which we need to follow to configure JON. JON 3.2 supports Oracle and PostgreSQL as a database backend. We will be using Oracle XE 11.2 to host the RHQ schema objects created at installation time. Furthermore, we have installed JON 3.2 on a single host machine using JDK1.7.0_45. For a list of supported configurations please view this page: https://access.redhat.com/site/articles/112523
We followed these steps to setup and configure JON:
1) Before running the JON installer scripts, we need to setup a user/schema in the Oracle database which will be used to store JON server configuration details and metrics data. I have set up a user named "RHQADMIN" for this purpose.
2) Unzip the JON installation package we downloaded earlier and configure the JON server properties file named rhq-server.properties located in the <JON_HOME>\bin directory before running the installation script.
3) There are a few notable sections which need to configure in the rhq-server.properties file to configure JON to run on a specific machine and against the Oracle database we preconfigured in step 2 above. These sections are noted below.
a) Provide the name of the database server name, port, database name, username and password where the RHQ schema objects will be hosted. You should provide the encoded user password for the "rhq.server.database.password" property. This is generated using the rhq-encode script located in the <RHQ_SERVER_HOME>/bin directory. For example, below are the configuration details for Oracle XE 11.2.
rhq.server.database.connection-url=jdbc:oracle:thin:@<db_hostname>:1521:xe
rhq.server.database.user-name=rhqadmin
rhq.server.database.password=xxxxxx
rhq.server.database.type-mapping=Oracle11g
rhq.server.database.server-name=unused
rhq.server.database.port=unused
rhq.server.database.db-name=unused
hibernate.dialect=org.hibernate.dialect.Oracle10gDialect
rhq.server.quartz.driverDelegateClass=org.quartz.impl.jdbcjobstore.oracle.OracleDelegate
b) Configure the properties "jboss.bind.address" and "jboss.bind.address.management" to the ip address or hostname were the server will be installed.
c) Configure these 5 installer properties appropriately were the properties "rhq.autoinstall.enabled" and "rhq.autoinstall.database" should be set to "true" and "auto" respectively :
rhq.autoinstall.enabled=true
rhq.autoinstall.database=auto
rhq.autoinstall.public-endpoint-address=<server_ip_address>
rhq.server.management.password=xxxxxx
rhq.storage.nodes=<server_hostname>
Now that we have configured the rhq-server.properties file, we now need to install the rhq-server, rhq-storage server and rhq-agent. I have installed all 3 on my local windows machine and since I am installing on windows these will be installed as services. To install the 3 JON/RHQ components above, we use the 'rhqctl' command. Execute the command rhqctl install from the console window which will install by default the 3 JON components aforementioned. The installer should take some minutes to install. Once the RHQ Server, storage engine and agent has been installed, we now can start these services using windows services explorer and navigate to http://<server-name>:7080 in the browser window. We should note I have only chosen to start the rhq storage and rhq server service as before we can start the rhq-agent, we firstly need to configure agent which we will discuss in the next section.

JON Agent/Plugin Configuration and JDG Instance Detection
The 3 node JDG cluster which we had set up previously referenced here runs on the same machine as the JDG server and the agent which we will now configure. The role of the RHQ agent is to send monitoring updates to the RHQ Server which can be then viewed in the RHQ dashboard console. We need to firstly configure the RHQ agent to the correct RHQ server and also provide the agent with the correct plugin packages to allow for this. The following steps should be completed to achieve this:
1) Open up a console window and navigate to the "bin" directory were RHQ has been installed and execute the batch script rhq-agent. The first time this command is run, the user is prompted for the agent name, agent hostname, server hostname and port. If you need to re-configure the agent at any time execute rhq-agent --fullcleanconfig. Providing the configuration details are correct, the agent should be registered with the RHQ server successfully.
2) The next step to configure the agent is to install the relevant plugins to allow the RHQ server to monitor the running JDG instances via the RHQ agent. We need to install the two plugin packs which we downloaded earlier. We will install these using the RHQ server console however you can also deploy them directly into the RHQ Server plugins directory located at <RHQ_SERVER_HOME>/plugins.
3) To install the two plugins previously mentioned, unzip the two plugin installer zip files into a directory on your file system. Navigate to the "Administration" tab in the RHQ server web console, click on the "server plugin"s menu option and now click on the "choose file" button beside the upload plugin label in this screen. The two plugins have been uploaded to the server and we now want for these plugins to be downloaded to the RHQ agent which can be achieved by either restarting the rhq-agent or by clicking on the "Agent Plugins" menu option and then by pressing the "scan for updates" button which should trigger the copying of the JDG plugins over to the agent "plugins" directory. Providing the agent has been updated with the two previously uploaded plugins, these should be visible in your <RHQ_AGENT_HOME>/plugins directory like in the screenshot below.

RHQ Server JDG Resource Configuration and Monitoring Setup
Now that the RHQ server, agent and JDG plugins have bee installed, the last part to setup monitoring of the cache instances running on the JDG cluster is to configure the RHQ Server using the RHQ server web console to indicate what JDG servers we wish to monitor and what monitoring metrics we wish to gather on the distributed cache instance.
To allow the server to detect and monitor the JDG instances, we need to complete the following steps:
1) Start up all JDG instances which we wish to monitor and now navigate to the "Inventory" tab and then click on the menu option named "Discovery Queue" in the RHQ server web console. You should now view the 3 running JDG instances which should be selected before clicking on the "Import" button at the bottom of the screen to import these resources into the RHQ Server configuration for monitoring.
2) Now click the "Servers" menu option in the "Inventory" window and you should be able to view the newly imported JDG instances. We now need to enter the password details for a user configured under management realm for each JDG instance. To set the password, click on each JDG instance then the"Connection Settings" tab.
Providing there are no issues with the RHQ server and agent configuration details, the server should be marked as available in the "Child Resources" screen under the "Inventory" tab( A Green Tick should be visible under the Availability Column).
The last part will be to specify what metrics we wish to monitor and to view on either your own dashbaord or just to add to the default dashboard in the RHQ server console. To add new monitoring metrics to the RHQ server dashboard, click on the JDG instance, navigate to the "Child Resources" window, click on the "infinispan" resource and navigate to the cache instance we wish to monitor on the JDG instance. We wish to monitor the distributed cache named "directory-dist-cache" to our JDG cluster as mentioned in the previous blog . Now right click on the cache name and select the "Measurements" dropdown option and we are now presented with a number of cache metrics which we can choose from. We can view an example of various metrics available based on the screenshot below. We are provided with the option here to add these metrics to the default or to are own custom dashboard.